Fig. 1
Download original image
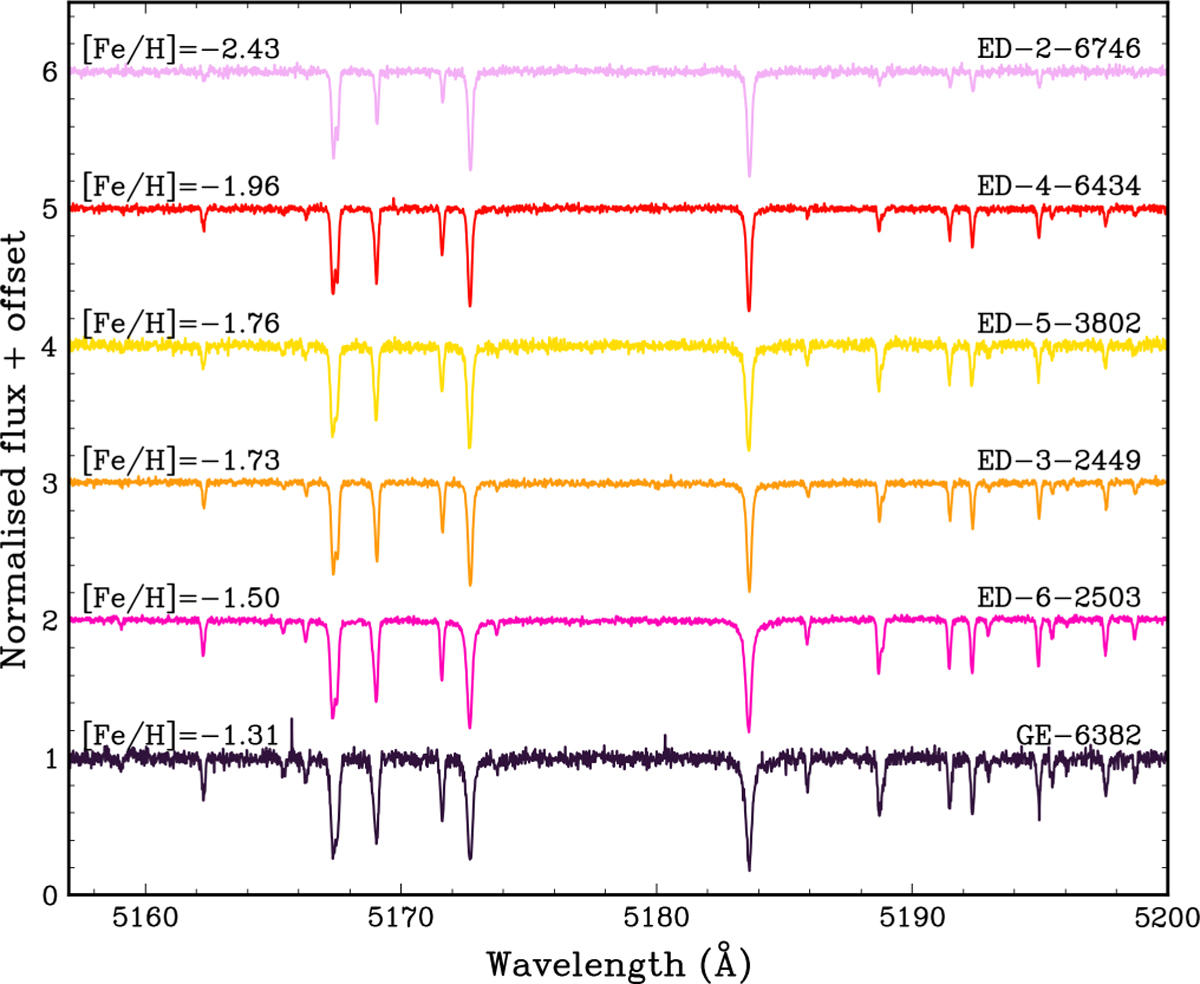
Spectra around the Mg triplet region of one star in each ED substructure and one GE star. The stars have been selected to have a similar Teff within the range of 6150 K – 6450 K and span a range of [Fe/H], demonstrating the difference in the lines for more metal-poor stars. The GE spectrum is plotted such that the continuum is normalised to 1 and then each other spectra are plotted with an offset of 1, ordered from most metal-rich to most metal-poor.
Current usage metrics show cumulative count of Article Views (full-text article views including HTML views, PDF and ePub downloads, according to the available data) and Abstracts Views on Vision4Press platform.
Data correspond to usage on the plateform after 2015. The current usage metrics is available 48-96 hours after online publication and is updated daily on week days.
Initial download of the metrics may take a while.