Fig. 10
Download original image
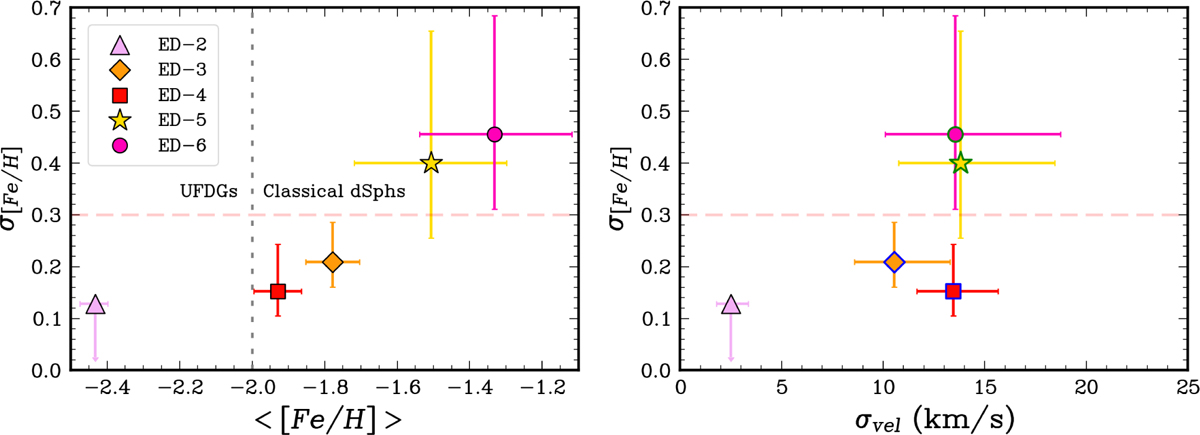
Left panel: mean metallicity and dispersion taken from the MCMC fit. Errors are taken from the 16th and 68th percentiles of the samples, where a dispersion is resolved; otherwise, an upper limit is shown at the 84th percentile, as seen for ED-2. The grey dashed line in the left panel corresponds to a [Fe/H] of −2 dex, the typical separation between classical dwarf spheroidals and ultra-faint dwarf galaxies. Right panel: FeII dispersion against the velocity dispersion. For the streams with multiple clumps (all except ED-2) in velocity space, the velocity dispersions were calculated from the clump with more than four members. For those outlined in green, the velocity clump from which the dispersion was calculated corresponds to the negative vz (or vx for ED-6) stream, and those outlined in blue correspond to the positive vz stream. The red dashed line in both panels at 0.3 dex represents the typical minimal [Fe/H] spread seen in dwarf galaxies (Simon 2019).
Current usage metrics show cumulative count of Article Views (full-text article views including HTML views, PDF and ePub downloads, according to the available data) and Abstracts Views on Vision4Press platform.
Data correspond to usage on the plateform after 2015. The current usage metrics is available 48-96 hours after online publication and is updated daily on week days.
Initial download of the metrics may take a while.