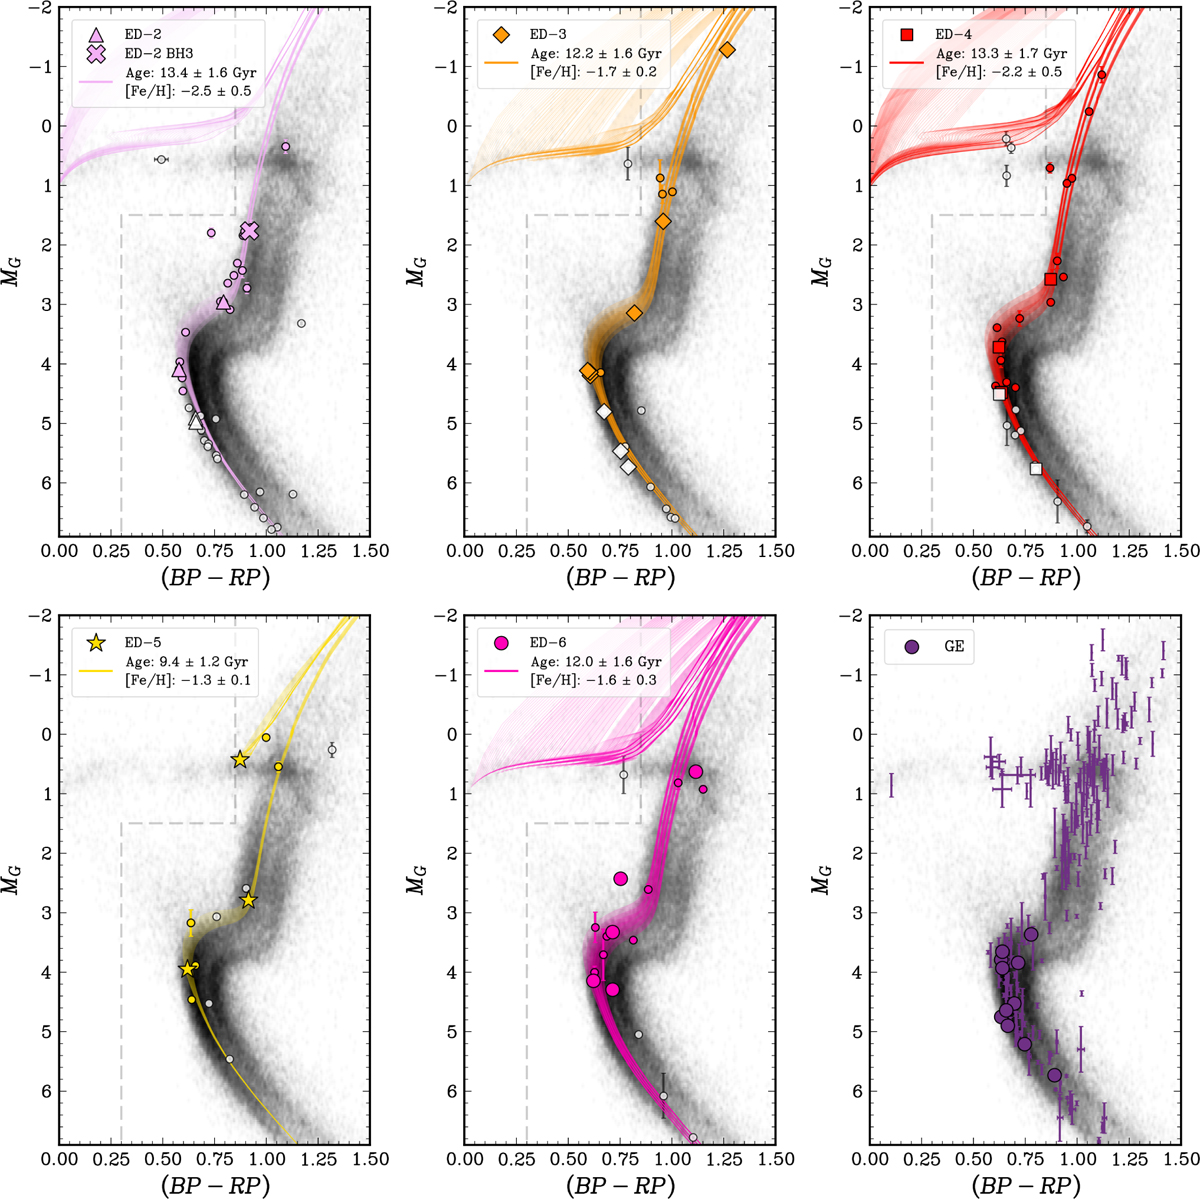
Fig. 3
Download original image
Colour magnitude diagrams of ED groups. The stars for which we measure chemical abundances are shown as larger markers with different symbols. The last panel shows a randomly selected 1% sample of GE stars and those for which we measure chemical abundances are shown with larger markers. In all cases, the colours and magnitudes have been corrected for extinction using the Lallement et al. (2022) dust maps. Horizontal branch stars have been removed from the isochrone fitting of the ED groups, indicated by the grey dashed line. Stars with high extinction AG > 0.7 or that are fainter than MG = 4.5 are also removed from the isochrone fitting. All of these stars not included in the isochrone fitting are shown as white symbols. The compatible BaSTi IAC alpha-enhanced isochrones for each of the ED groups are shown and the range of age and [Fe/H] that these isochrones span are given in the legend. The colour-magnitude shift (Δc, Δm) of (−0.035, 0.04) from Gallart et al. (2024) has been applied to the isochrones for fitting and plotting. The background shows a density plot of the local halo stars.
Current usage metrics show cumulative count of Article Views (full-text article views including HTML views, PDF and ePub downloads, according to the available data) and Abstracts Views on Vision4Press platform.
Data correspond to usage on the plateform after 2015. The current usage metrics is available 48-96 hours after online publication and is updated daily on week days.
Initial download of the metrics may take a while.