Fig. 10.
Download original image
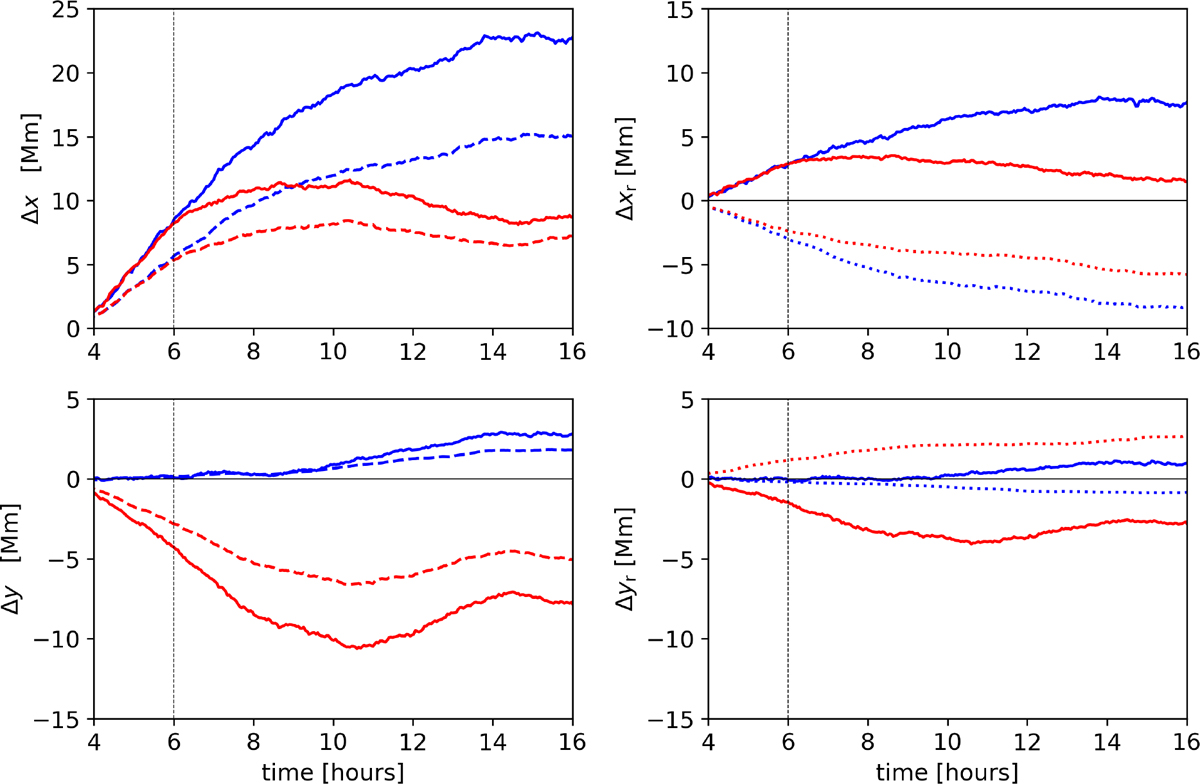
Separation of polarities for the non-rotational simulation (blue) and the rotational simulation (red). We show the geometric separation without a Bz threshold (solid curves, Δxg) and the separation expected from the flows (Eqs. (11) and (12); dashed curves, Δxf). The vertical line at 6 hours is close to the time when most of the magnetic flux has emerged (see Fig. 6).
Current usage metrics show cumulative count of Article Views (full-text article views including HTML views, PDF and ePub downloads, according to the available data) and Abstracts Views on Vision4Press platform.
Data correspond to usage on the plateform after 2015. The current usage metrics is available 48-96 hours after online publication and is updated daily on week days.
Initial download of the metrics may take a while.