Fig. 2.
Download original image
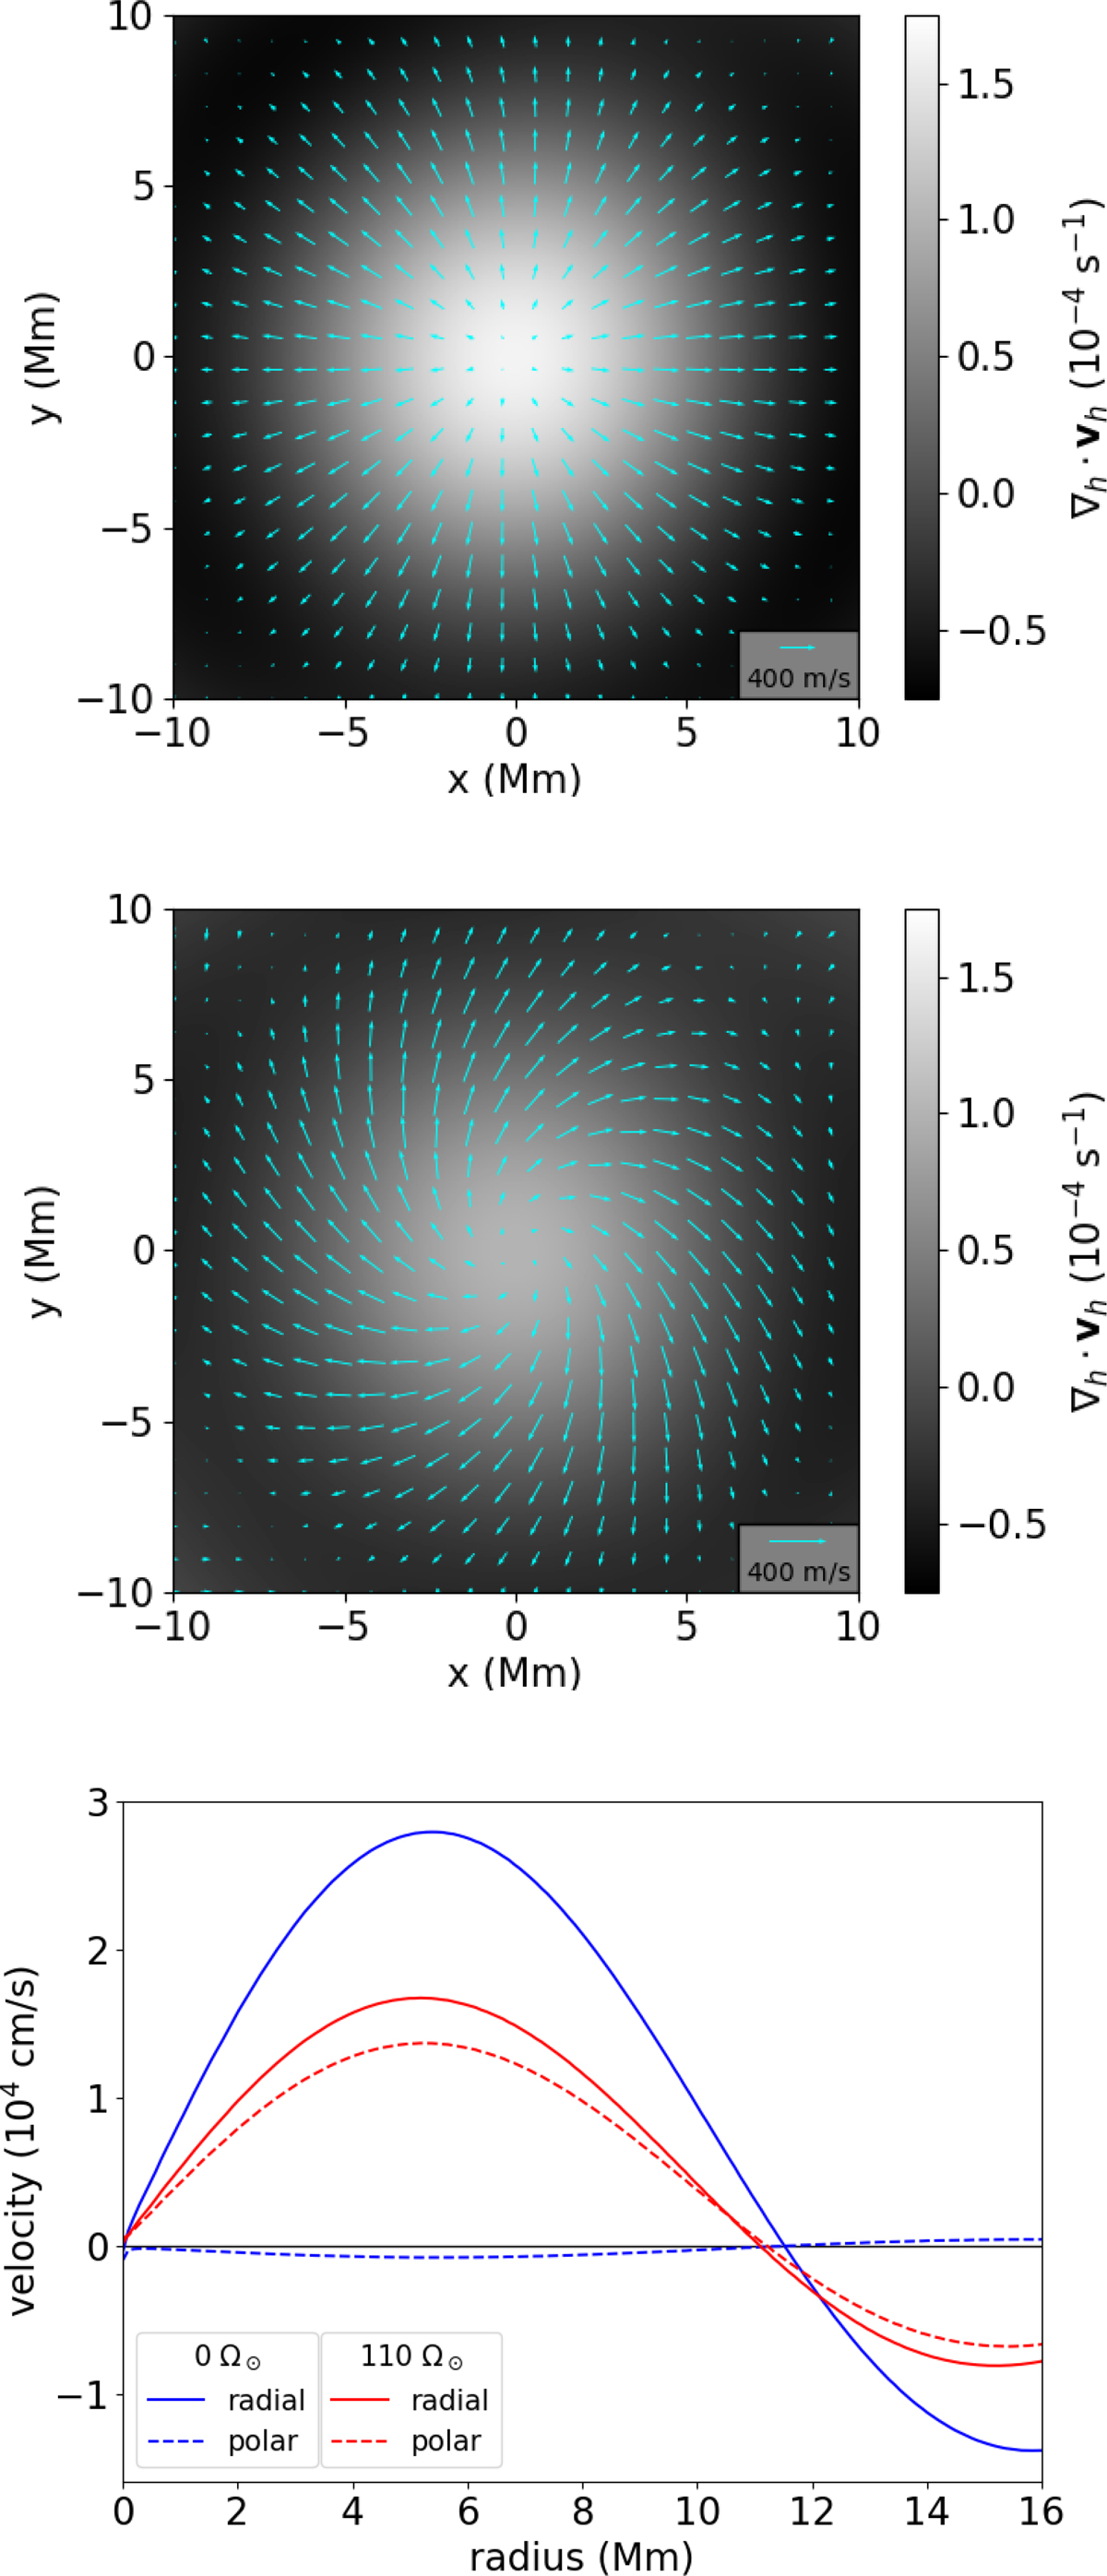
Top panel: horizontal flow divergence of the average supergranule in the non-rotational hydrodynamic simulation. The cyan arrows represent the horizontal flows at the surface. Middle panel: same as the top panel but for the rotational hydrodynamic simulation. Bottom panel: azimuthal averages of the radial velocity (![]() ) and polar velocity (
) and polar velocity (![]() ) of the flows for the average supergranule. All quantities are measured relative to the centre of the supergranule. The polar velocity is defined as positive in the clockwise direction.
) of the flows for the average supergranule. All quantities are measured relative to the centre of the supergranule. The polar velocity is defined as positive in the clockwise direction.
Current usage metrics show cumulative count of Article Views (full-text article views including HTML views, PDF and ePub downloads, according to the available data) and Abstracts Views on Vision4Press platform.
Data correspond to usage on the plateform after 2015. The current usage metrics is available 48-96 hours after online publication and is updated daily on week days.
Initial download of the metrics may take a while.