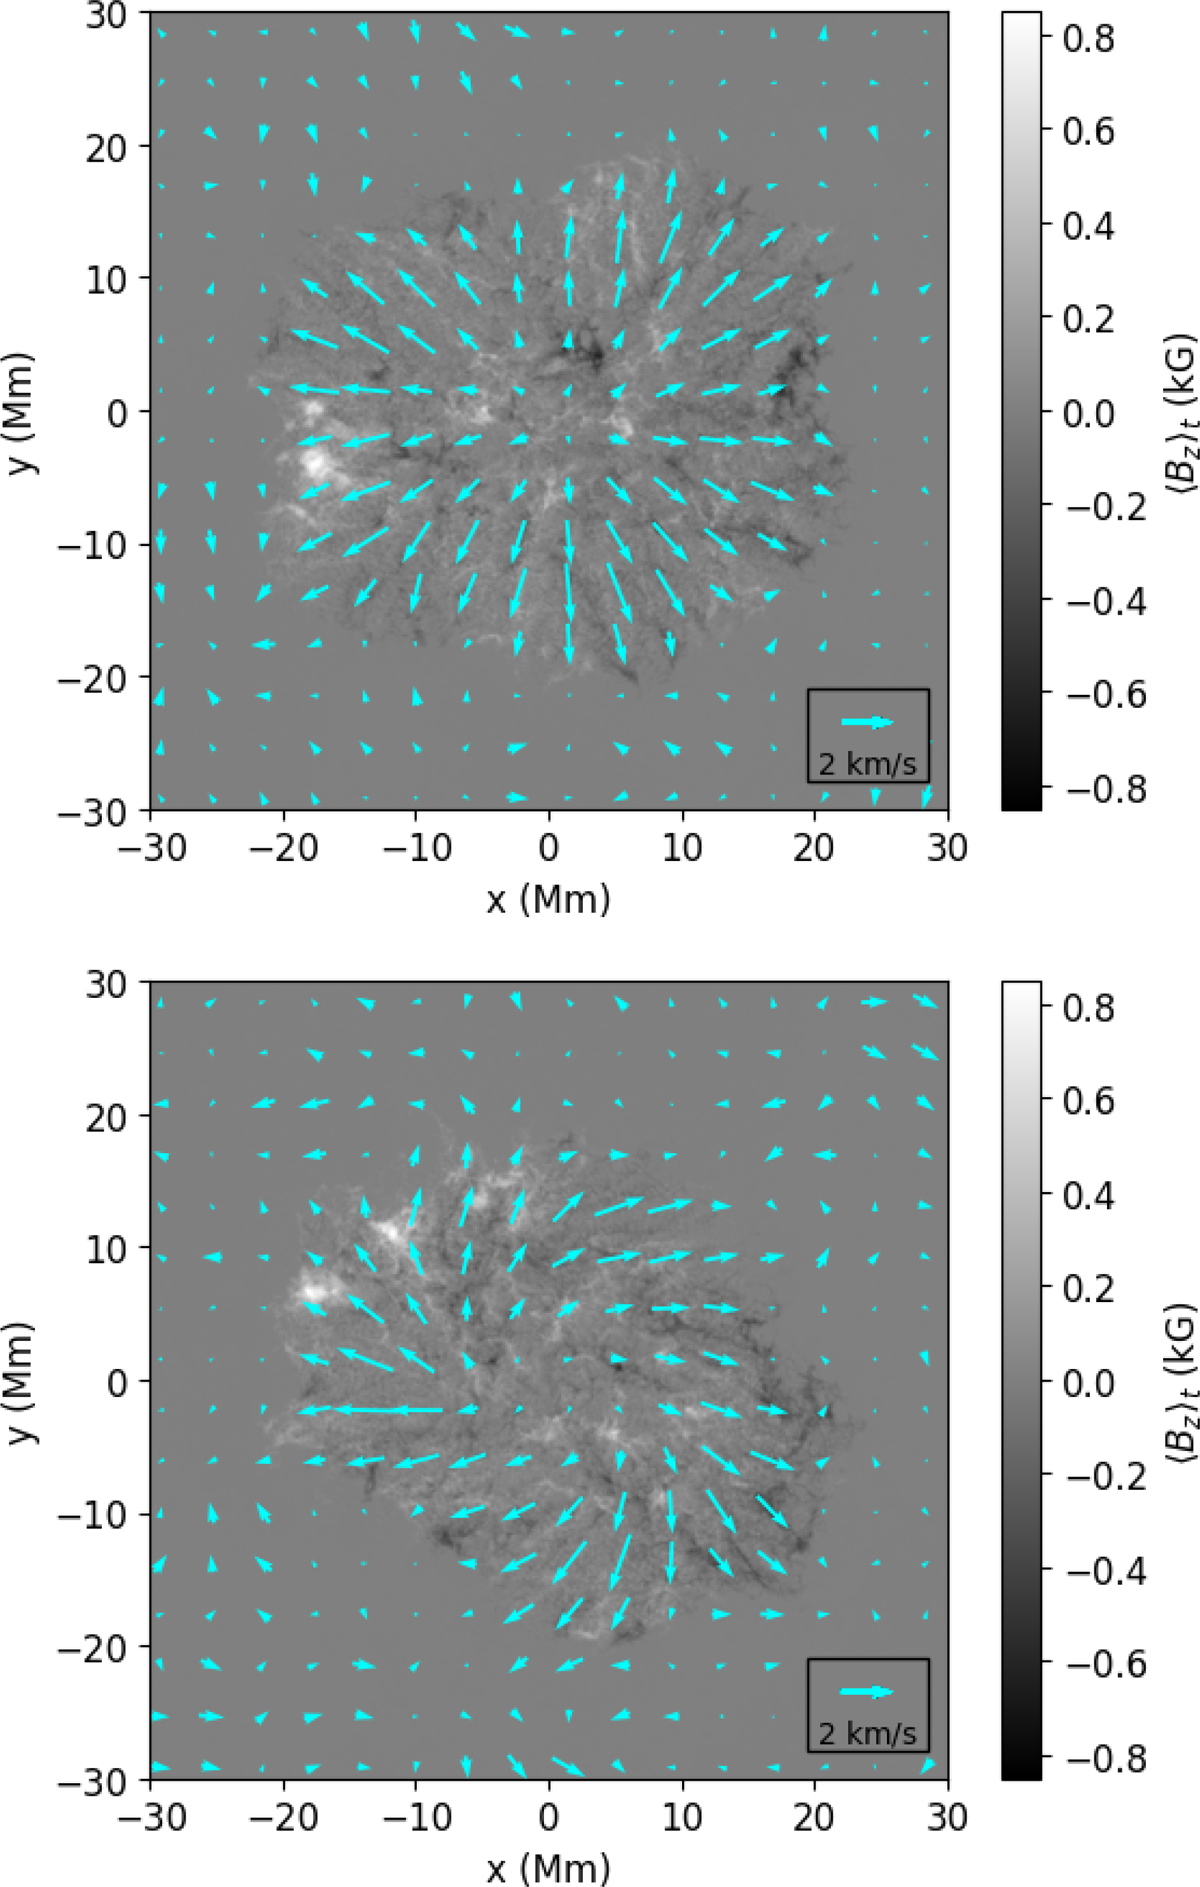
Fig. 9.
Download original image
Surface flow velocities (cyan arrows) and vertical magnetic field averaged over time from t = 4.25 h to t = 5.44 h for the non-rotational (0 Ω⊙) hydrodynamic simulation (top) and the rotational (110 Ω⊙) hydrodynamic simulation (bottom). The velocity has also been spatially smoothed for clarity by a Gaussian with standard deviation of 2.4 Mm. Note that this has been computed at a constant geometrical height, at z = 480 pixels = 15.360 Mm from the bottom of the box.
Current usage metrics show cumulative count of Article Views (full-text article views including HTML views, PDF and ePub downloads, according to the available data) and Abstracts Views on Vision4Press platform.
Data correspond to usage on the plateform after 2015. The current usage metrics is available 48-96 hours after online publication and is updated daily on week days.
Initial download of the metrics may take a while.