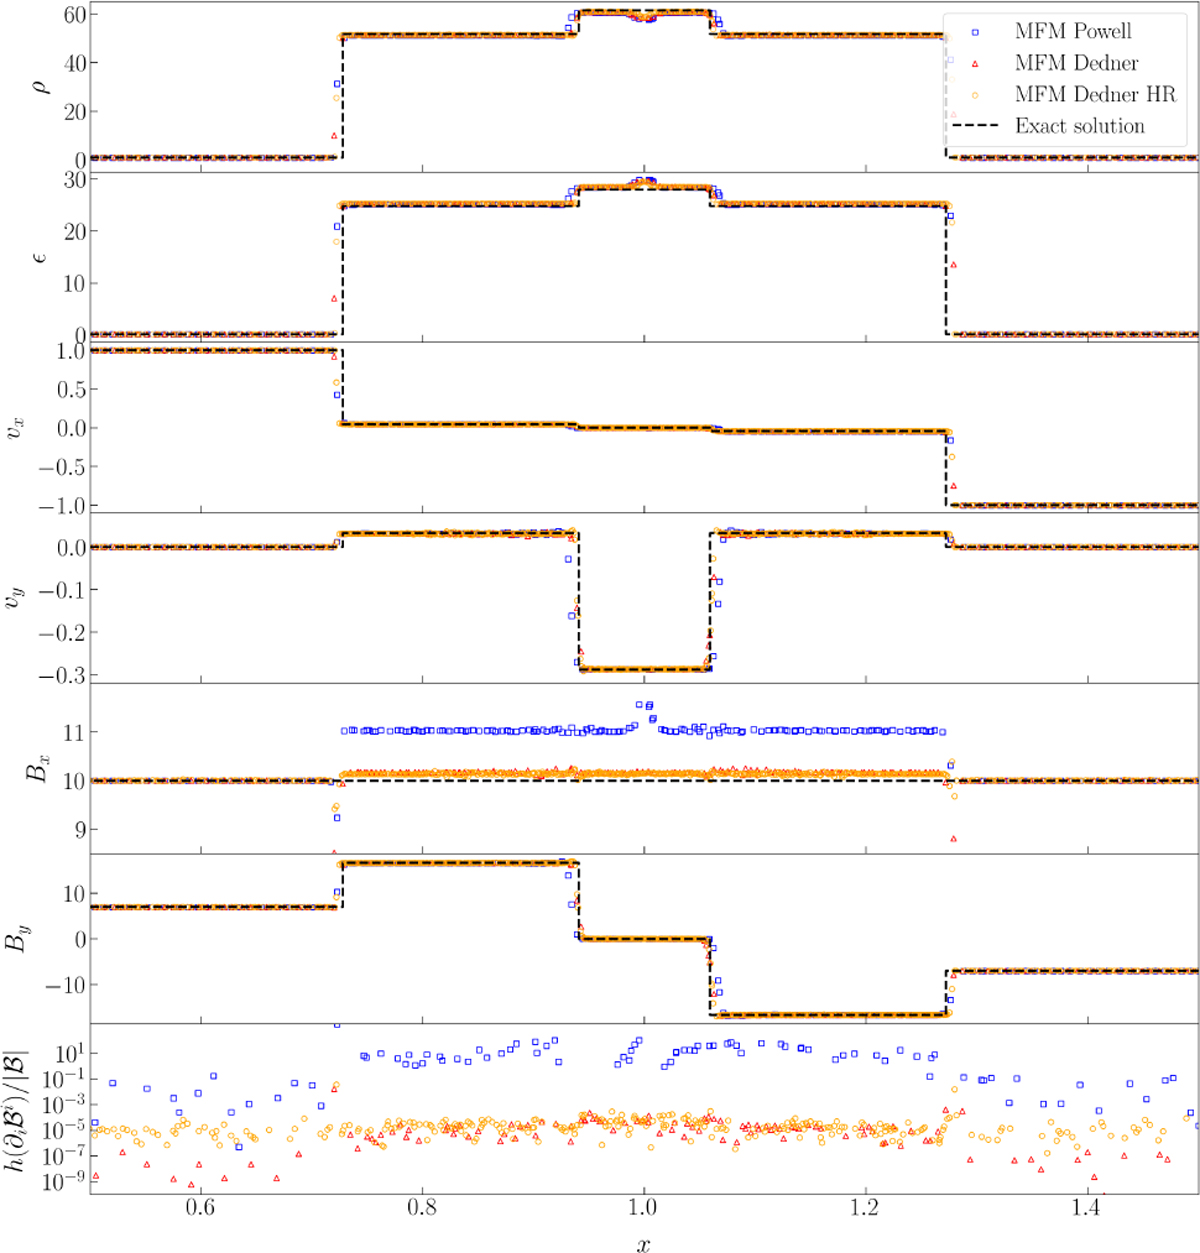
Fig. 3
Download original image
Slice at time t = 0.4 and constant y of the primitive quantities from the Balsara4 test performed in the MFM mode. The magnetic field divergence in units of its intensity is plotted in the bottom panel. Blue squares mark the solution computed with Powell terms only, while red triangles indicate the one computed with the complete divergence cleaning scheme. The high-resolution run is displayed with orange circles. Quantities vz and Bz are not plotted but exhibit analogous behaviours to vy and By. The correct solution, evaluated through the exact Riemann solver by Giacomazzo & Rezzolla (2006), is plotted with a dashed black line.
Current usage metrics show cumulative count of Article Views (full-text article views including HTML views, PDF and ePub downloads, according to the available data) and Abstracts Views on Vision4Press platform.
Data correspond to usage on the plateform after 2015. The current usage metrics is available 48-96 hours after online publication and is updated daily on week days.
Initial download of the metrics may take a while.