Fig. 10
Download original image
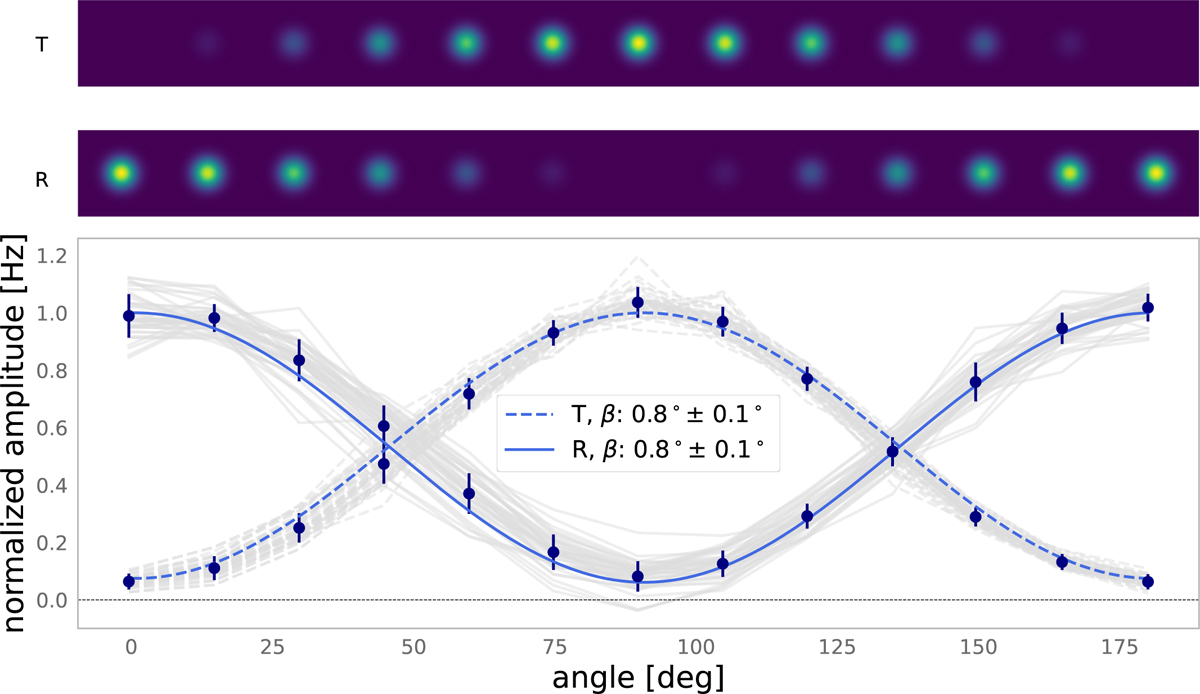
Top panels: projected maps of the polarized source (P1) oriented at different angles as seen by the transmission (T) and reflection (R) arrays. Bottom panel: intensity of P1’s maps as a function of the orientation angle for the transmission (T, dashed curves) and reflection (R, solid curves) arrays obtained using an aperture photometry technique and fitted to derive β = 0.8° ± 0.1°. The superposed gray lines represent individual results for the selection of best KIDs.
Current usage metrics show cumulative count of Article Views (full-text article views including HTML views, PDF and ePub downloads, according to the available data) and Abstracts Views on Vision4Press platform.
Data correspond to usage on the plateform after 2015. The current usage metrics is available 48-96 hours after online publication and is updated daily on week days.
Initial download of the metrics may take a while.