Open Access
Fig. 7
Download original image
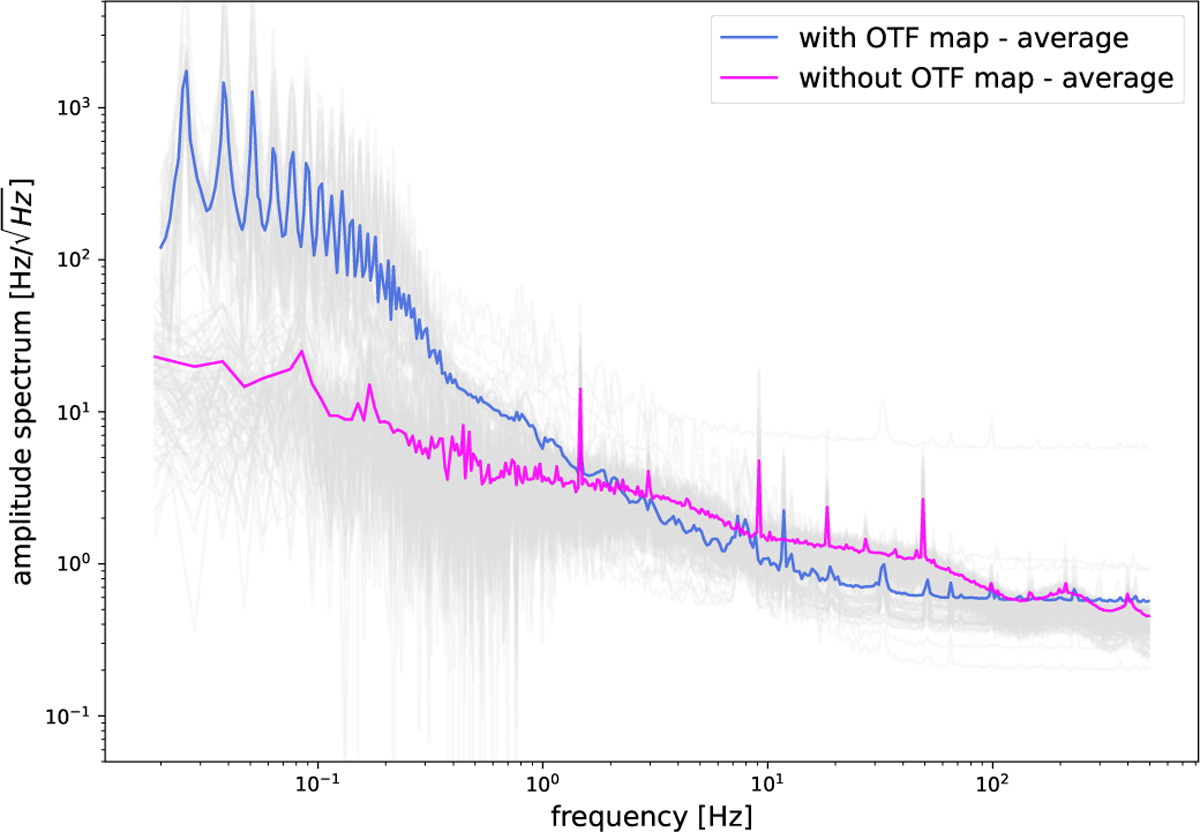
Comparison of spectra derived in two different conditions: in blue, we show the spectrum computed over data when the photometric source is being scanned, while in magenta we show the pure instrumental noise. In gray the curves for each KID in the selection are shown.
Current usage metrics show cumulative count of Article Views (full-text article views including HTML views, PDF and ePub downloads, according to the available data) and Abstracts Views on Vision4Press platform.
Data correspond to usage on the plateform after 2015. The current usage metrics is available 48-96 hours after online publication and is updated daily on week days.
Initial download of the metrics may take a while.