Open Access
Fig. 9
Download original image
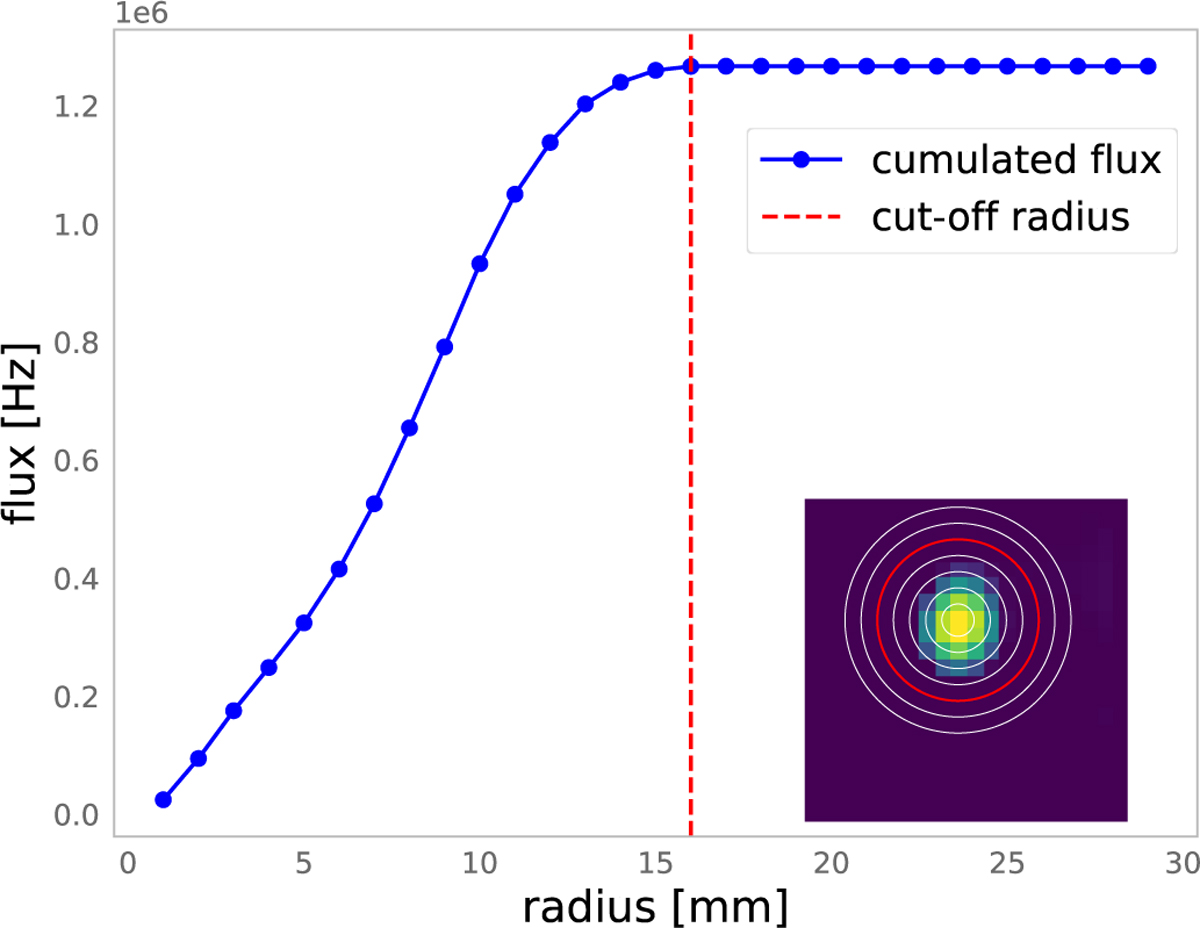
Aperture photometry technique used to estimate the cumulative flux within a defined radius. The red dashed line in the flux plot and the corresponding circle on the map represent the selected cutoff radius, indicating the boundary considered for analysis.
Current usage metrics show cumulative count of Article Views (full-text article views including HTML views, PDF and ePub downloads, according to the available data) and Abstracts Views on Vision4Press platform.
Data correspond to usage on the plateform after 2015. The current usage metrics is available 48-96 hours after online publication and is updated daily on week days.
Initial download of the metrics may take a while.