Fig. 2.
Download original image
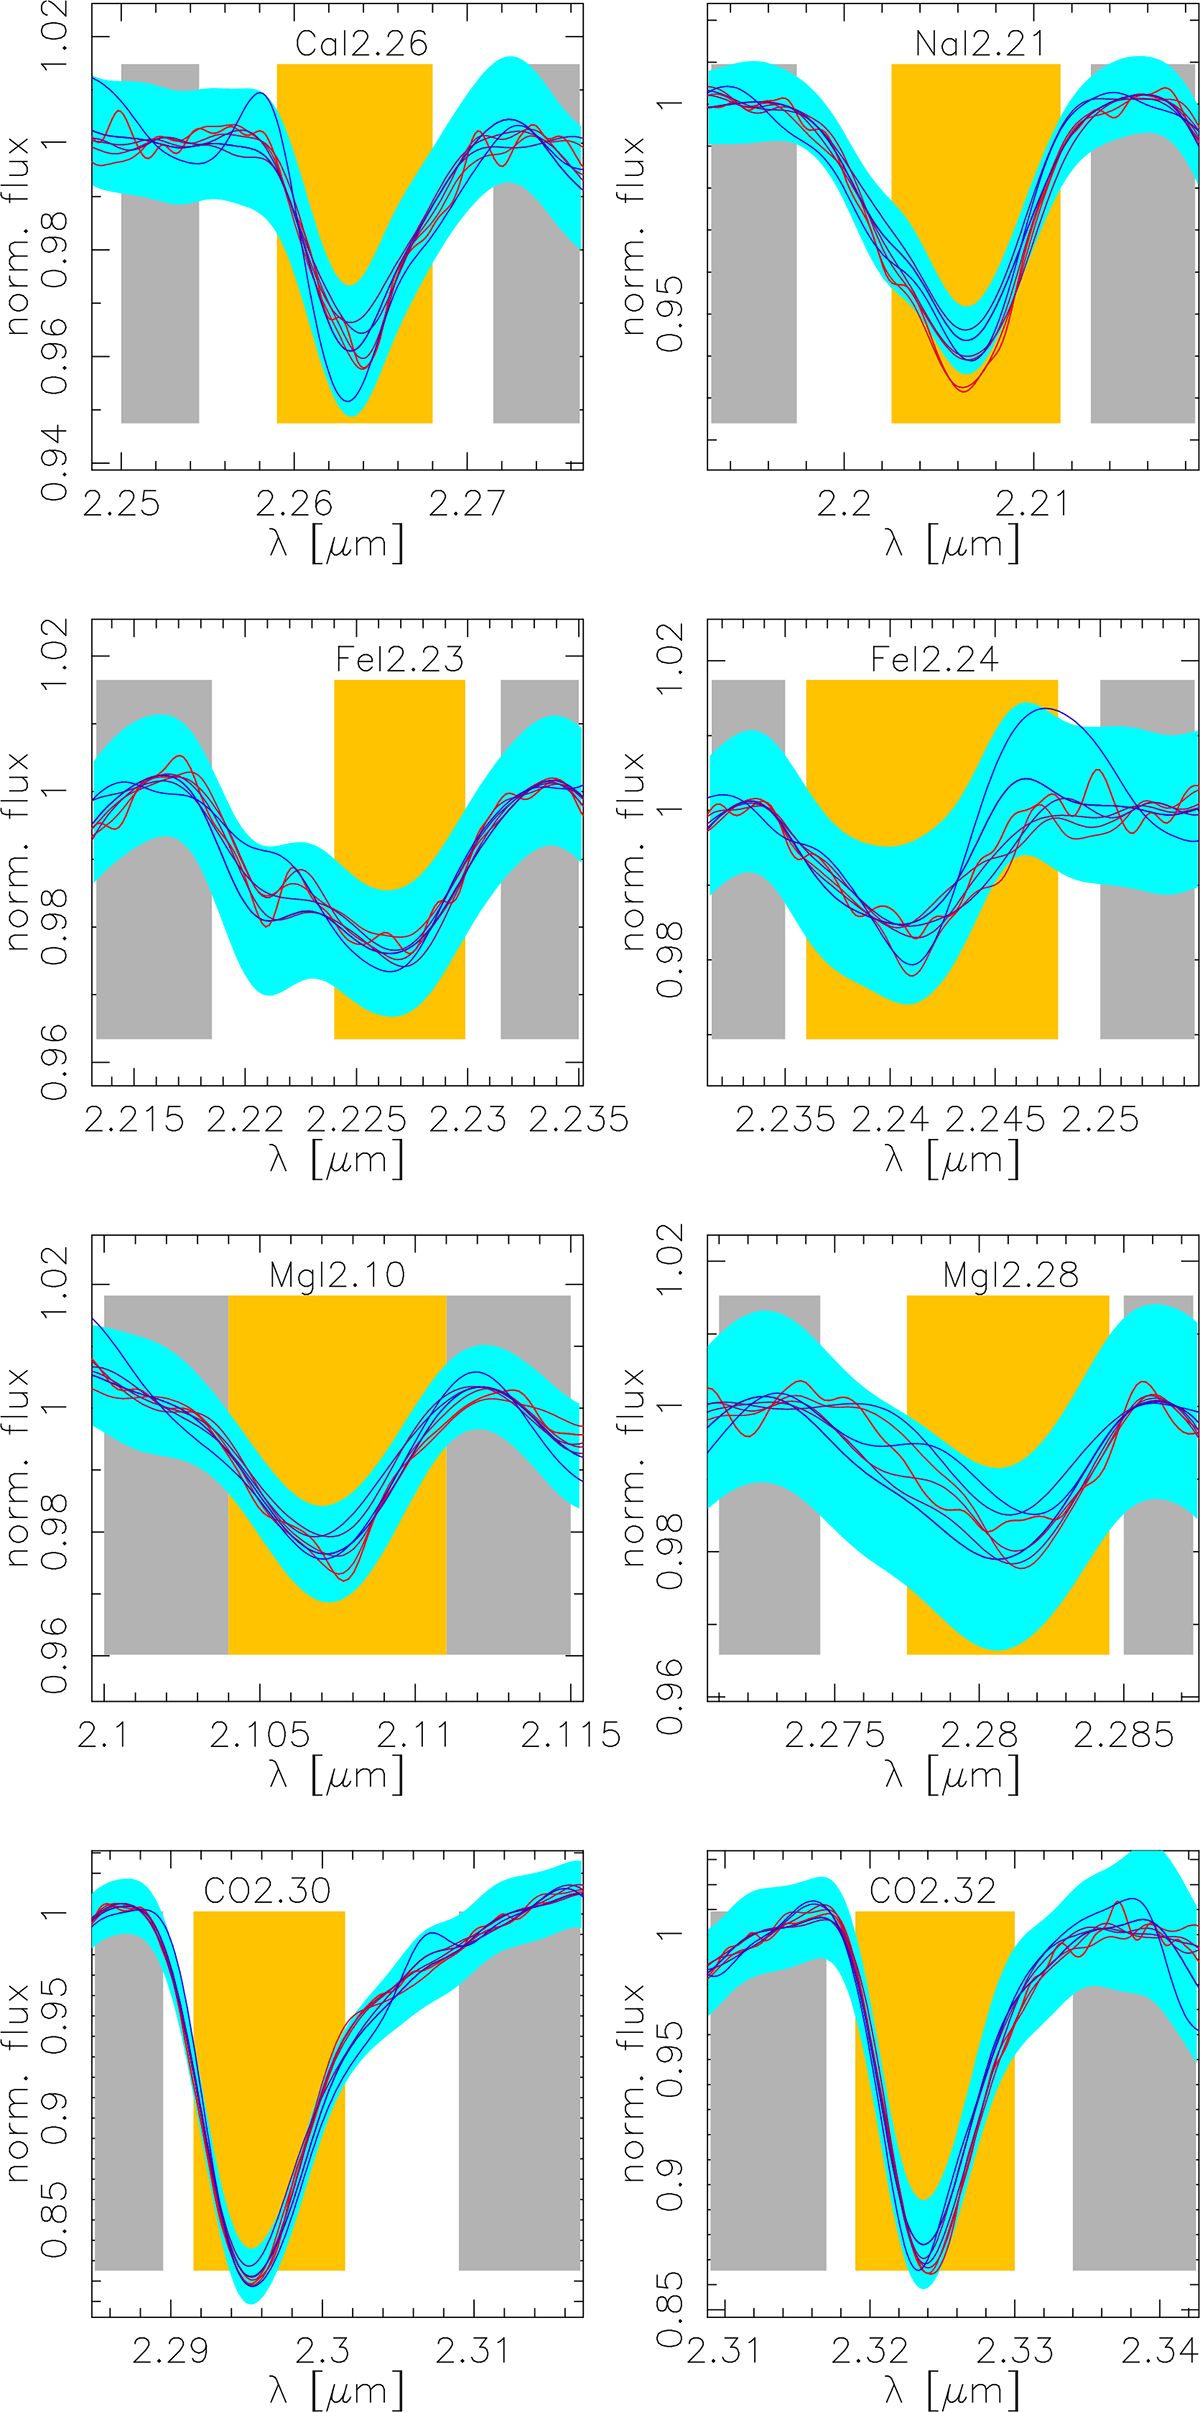
K-band spectra of M87 in the regions where spectral indices are measured. From left to right, and top to bottom, the plots correspond to CaI2.26 and NaI2.21 (first row), FeI2.23 and FeI2.24 (second row), MgI2.10 and MgI2.28 (third row), CO2.30 and CO2.32 (bottom row), respectively. Spectra with different colors correspond to different galactocentric distances, with the same color coding as in Fig. 1. Gray regions mark the blue and red pseudocontinua of the indices, while the central passbands are marked in orange. All spectra have been smoothed to the same σ of 320 km s−1, and normalized by linear fit of the pseudocontinua. Light blue regions are the 1 sigma uncertainties for the outermost spectrum.
Current usage metrics show cumulative count of Article Views (full-text article views including HTML views, PDF and ePub downloads, according to the available data) and Abstracts Views on Vision4Press platform.
Data correspond to usage on the plateform after 2015. The current usage metrics is available 48-96 hours after online publication and is updated daily on week days.
Initial download of the metrics may take a while.