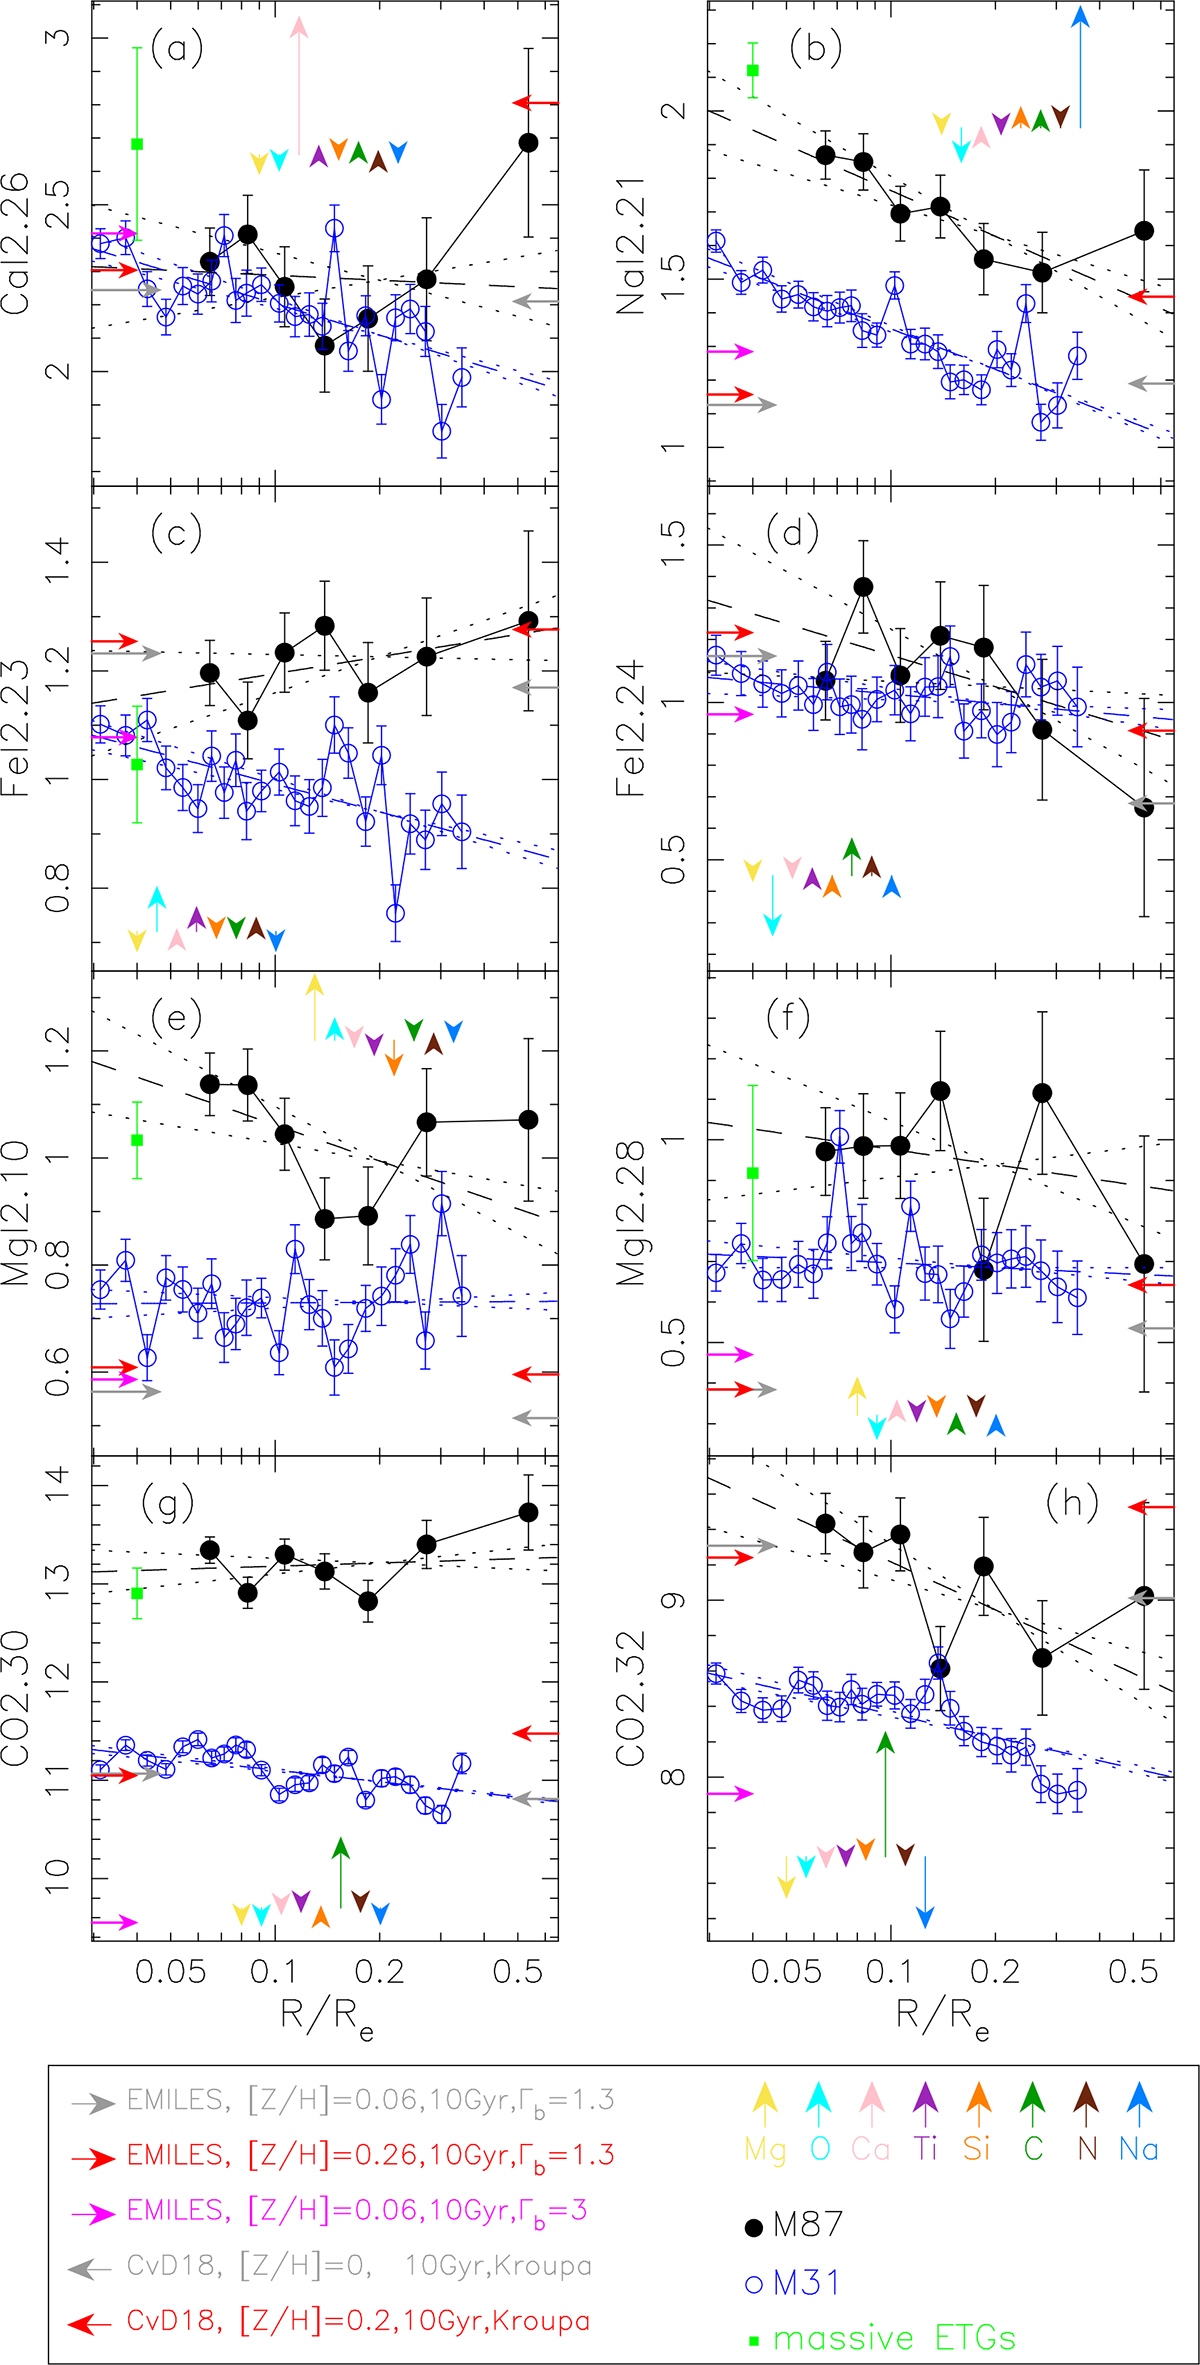
Fig. 3.
Download original image
K-band line strength indices as a function of normalized galactocentric distance, R/Re. From left to right, and top to bottom, the Figure plots the same indices as in Fig. 2. The legend in the bottom panel indicates the symbols used in the plot. Filled black dots with (1-sigma) error bars plot the indices of M87. Data for massive ETGs and the bulge of M31 are plotted with filled green squares and open blue circles, respectively. Dashed black and blue lines represent the best-fitting radial trends for M87 and M31, respectively. Dotted black and blue lines show the ±1 sigma uncertainties on the slopes of the linear relations. In each panel, predictions of EMILES-BaSTI (CvD18) models are plotted as small, rightwards (leftwards), horizontal arrows. Different colors indicate models with different metallicity and IMF slope, as indicated in the legend. Index changes due to variations of individual abundance ratios in CvD18 models are plotted with colored vertical arrows, showing the effect of increasing each element by +0.3 dex, with the exception of C, which is increased by 0.15 dex.
Current usage metrics show cumulative count of Article Views (full-text article views including HTML views, PDF and ePub downloads, according to the available data) and Abstracts Views on Vision4Press platform.
Data correspond to usage on the plateform after 2015. The current usage metrics is available 48-96 hours after online publication and is updated daily on week days.
Initial download of the metrics may take a while.