Fig. 1
Download original image
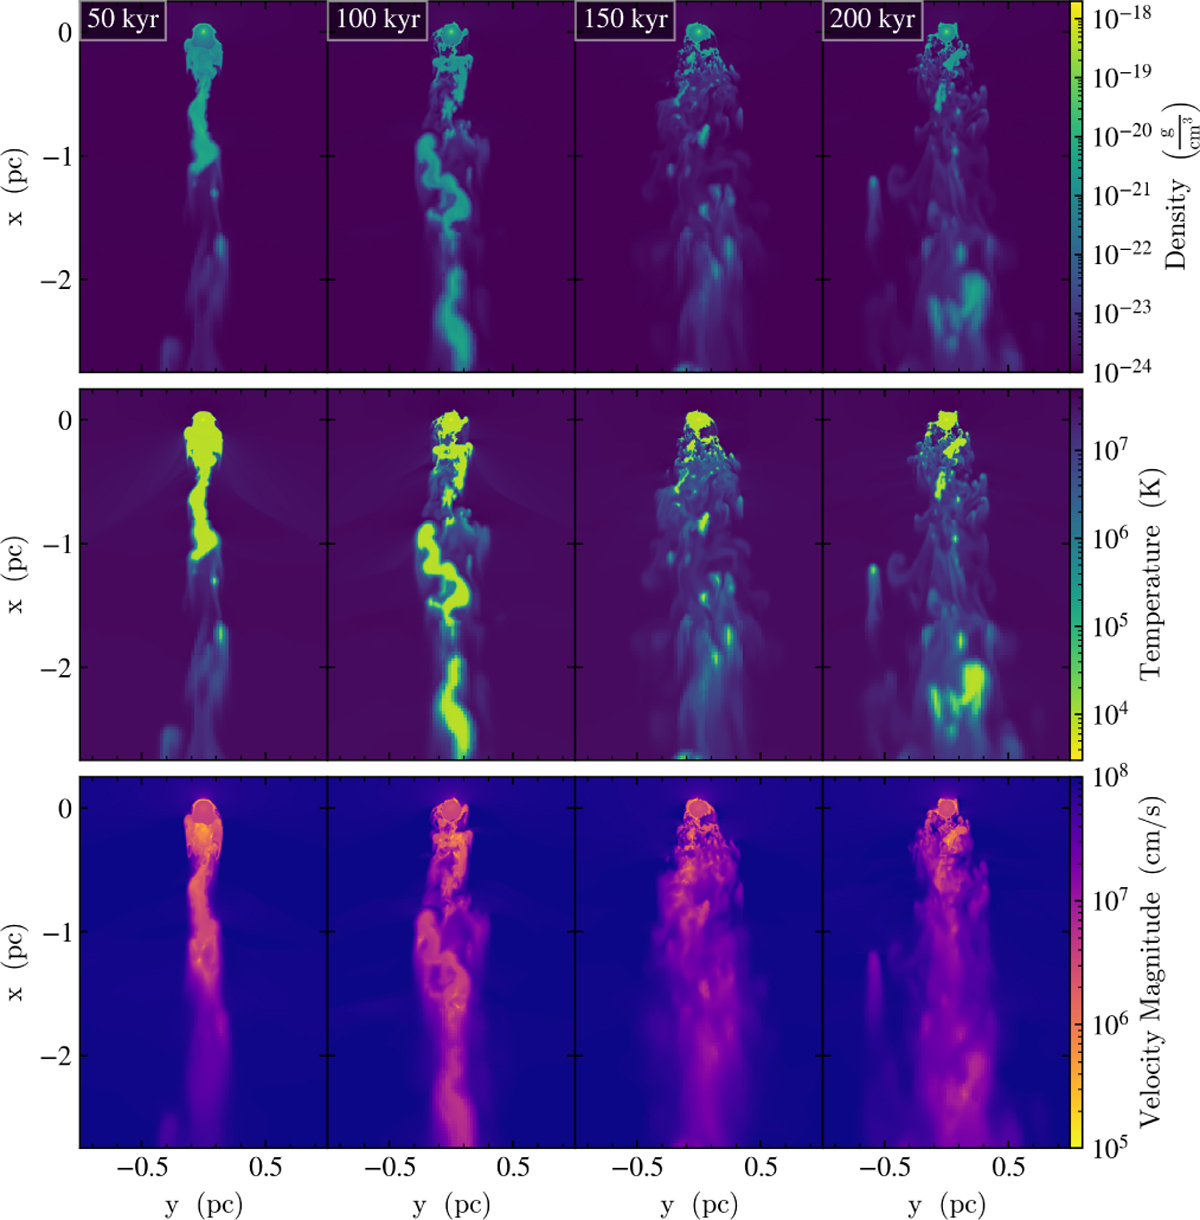
x − y slices through our simulation of the plane z = 0 at 50, 100, 150, and 200 kyr, showing distributions of density (upper), temperature (middle), and velocity magnitude (lower). The cluster wind is flowing from top to bottom, and the RSG is positioned at the origin. The colour scale is chosen to highlight dense, cool, and slow-moving material from the RSG.
Current usage metrics show cumulative count of Article Views (full-text article views including HTML views, PDF and ePub downloads, according to the available data) and Abstracts Views on Vision4Press platform.
Data correspond to usage on the plateform after 2015. The current usage metrics is available 48-96 hours after online publication and is updated daily on week days.
Initial download of the metrics may take a while.