Fig. A.1
Download original image
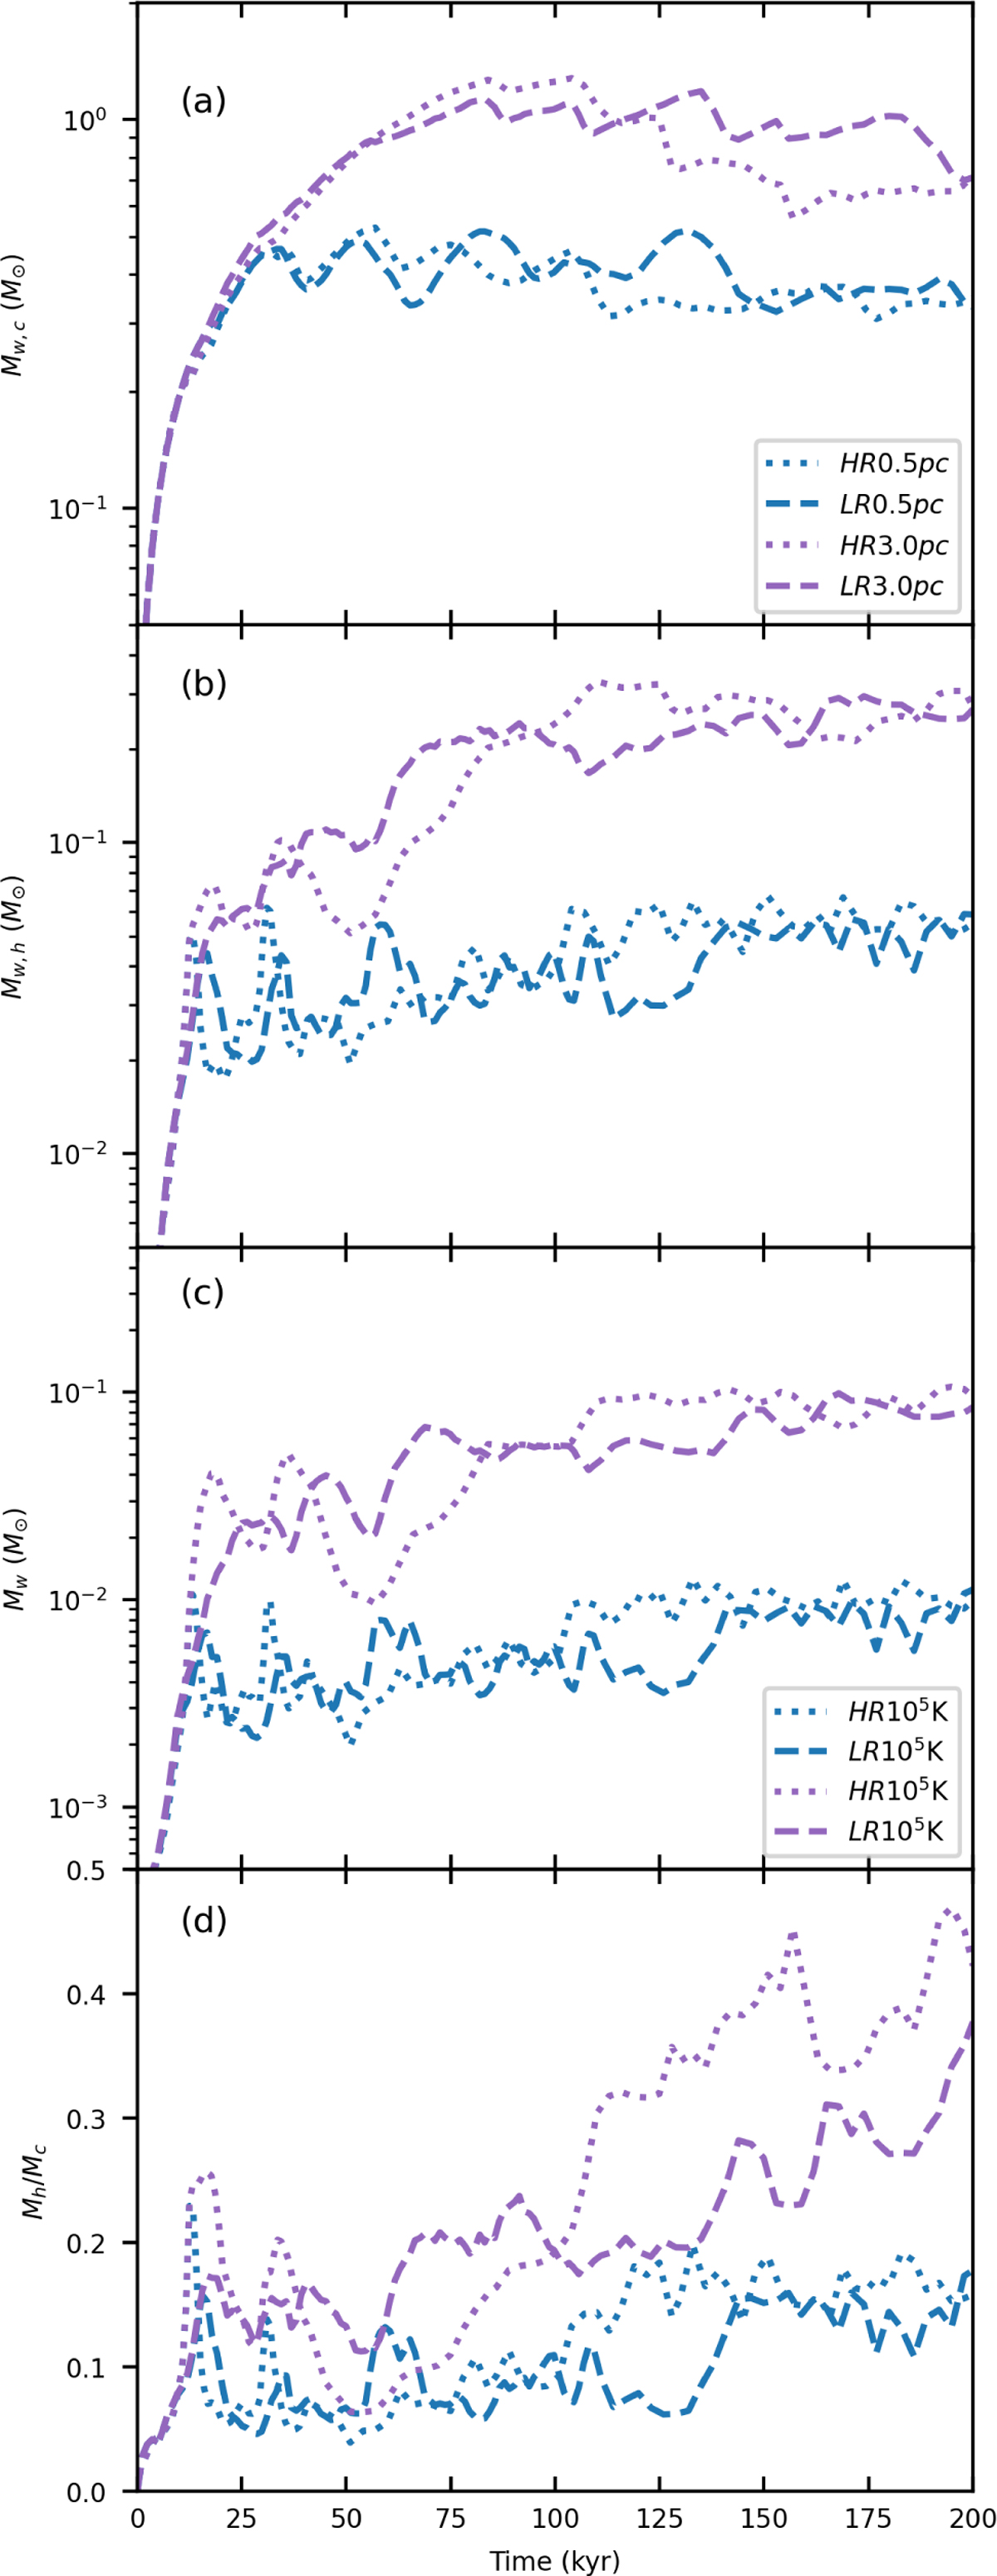
Time evolution of stellar wind masses of different temperatures for the low (dashed) and high (dotted) resolution models: Panel a: Mass of cool (T < 104 K) material vs time enclosed within spheres of 0.5 pc (blue) and 3.0 pc (purple). Panel b: Idem for hot (T > 104 K) material. Panel c: Plot of material with T > 104 K (blue) and T > 105 K (purple) enclosed within spheres of 0.5 pc (blue) and 3.0 pc (purple). Panel d: Ratio of cool (T < 104 K) to hot (T > 104 K) material.
Current usage metrics show cumulative count of Article Views (full-text article views including HTML views, PDF and ePub downloads, according to the available data) and Abstracts Views on Vision4Press platform.
Data correspond to usage on the plateform after 2015. The current usage metrics is available 48-96 hours after online publication and is updated daily on week days.
Initial download of the metrics may take a while.