Fig. 5
Download original image
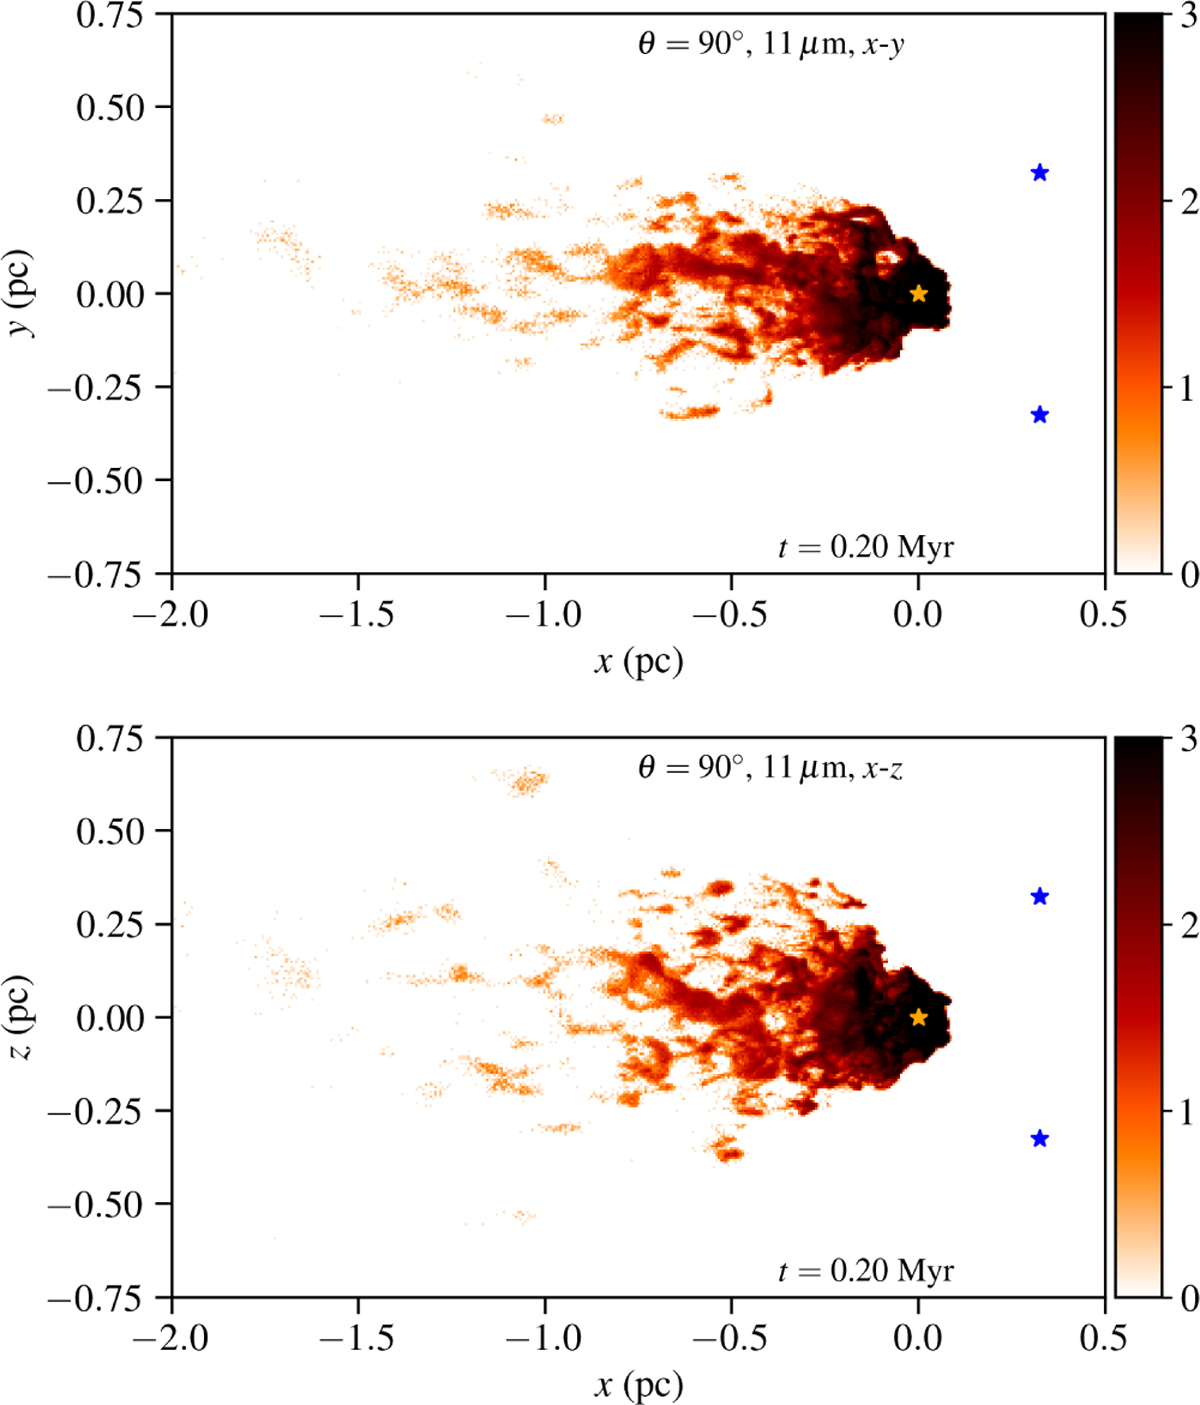
Thermal dust emission maps from the final snapshot of our simulation, showing surface brightness at 11 µm on a logarithmic scale. The colour bar shows log10 I11 µm/(MJy ster−1). The radiation sources heating the dust are the RSG at the origin (orange star) and two sources indicated by the blue stars at x = 0.32 pc and z = ±0.32 pc.
Current usage metrics show cumulative count of Article Views (full-text article views including HTML views, PDF and ePub downloads, according to the available data) and Abstracts Views on Vision4Press platform.
Data correspond to usage on the plateform after 2015. The current usage metrics is available 48-96 hours after online publication and is updated daily on week days.
Initial download of the metrics may take a while.