Fig. 7
Download original image
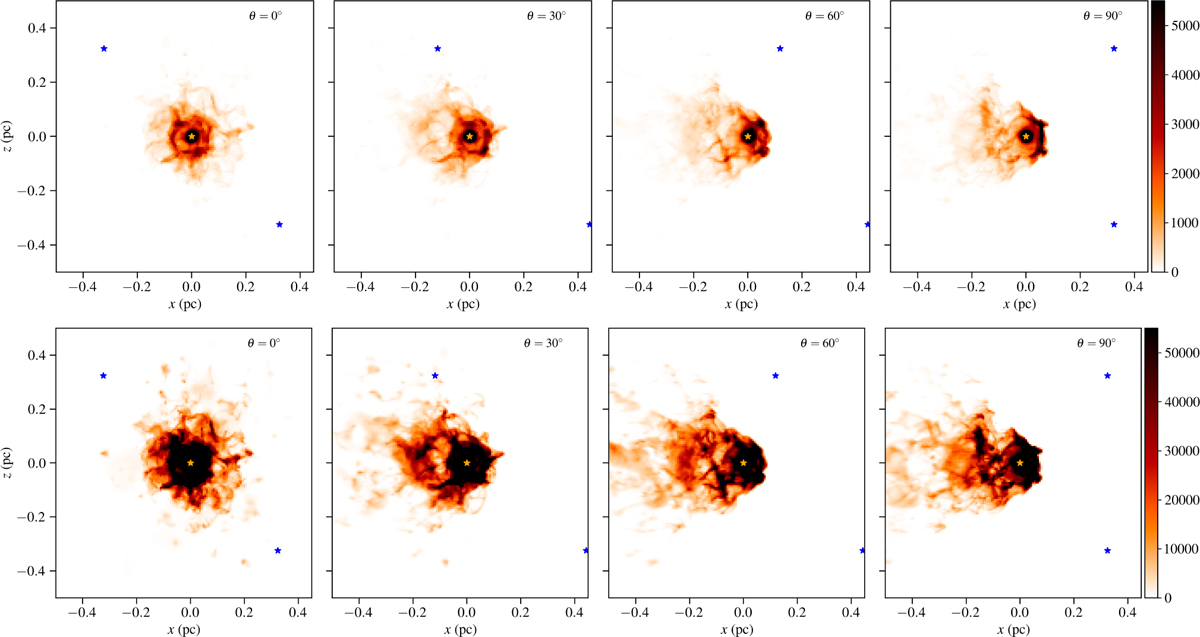
Synthetic thermal dust emission maps at 11 µm (top row) and 24 µm (bottom row) viewed from different angles, with emission shown on a linear scale in units of MJy ster−1. The location of the RSG is shown by the orange star, and the other two synthetic radiation sources by the blue stars projected at z = ±0.32 pc. The angle θ is measured between the observer’s line of sight and the cluster-wind flow velocity.
Current usage metrics show cumulative count of Article Views (full-text article views including HTML views, PDF and ePub downloads, according to the available data) and Abstracts Views on Vision4Press platform.
Data correspond to usage on the plateform after 2015. The current usage metrics is available 48-96 hours after online publication and is updated daily on week days.
Initial download of the metrics may take a while.