Open Access
Fig. 9
Download original image
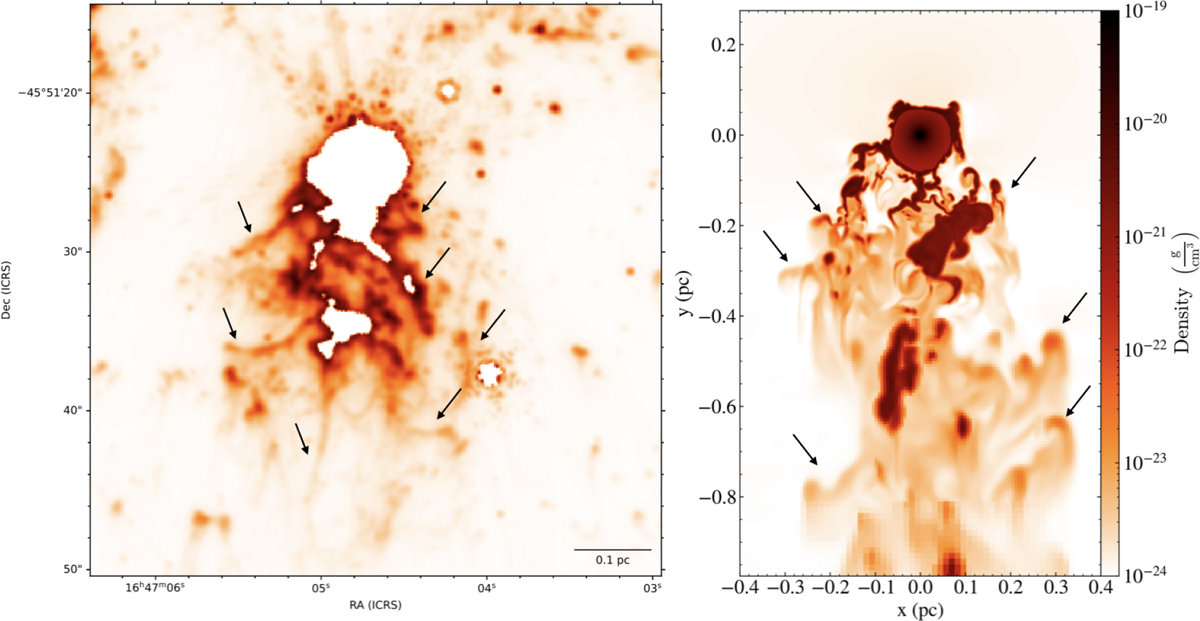
Left: JWST/MIRI F1130W observations towards W20. Right: simulation density map. In addition to the primary flow and cometary knots, there are extended features, indicated by the arrows, that connect to the primary flow and arise due to RT and/or KH instabilities.
Current usage metrics show cumulative count of Article Views (full-text article views including HTML views, PDF and ePub downloads, according to the available data) and Abstracts Views on Vision4Press platform.
Data correspond to usage on the plateform after 2015. The current usage metrics is available 48-96 hours after online publication and is updated daily on week days.
Initial download of the metrics may take a while.