Fig. 1.
Download original image
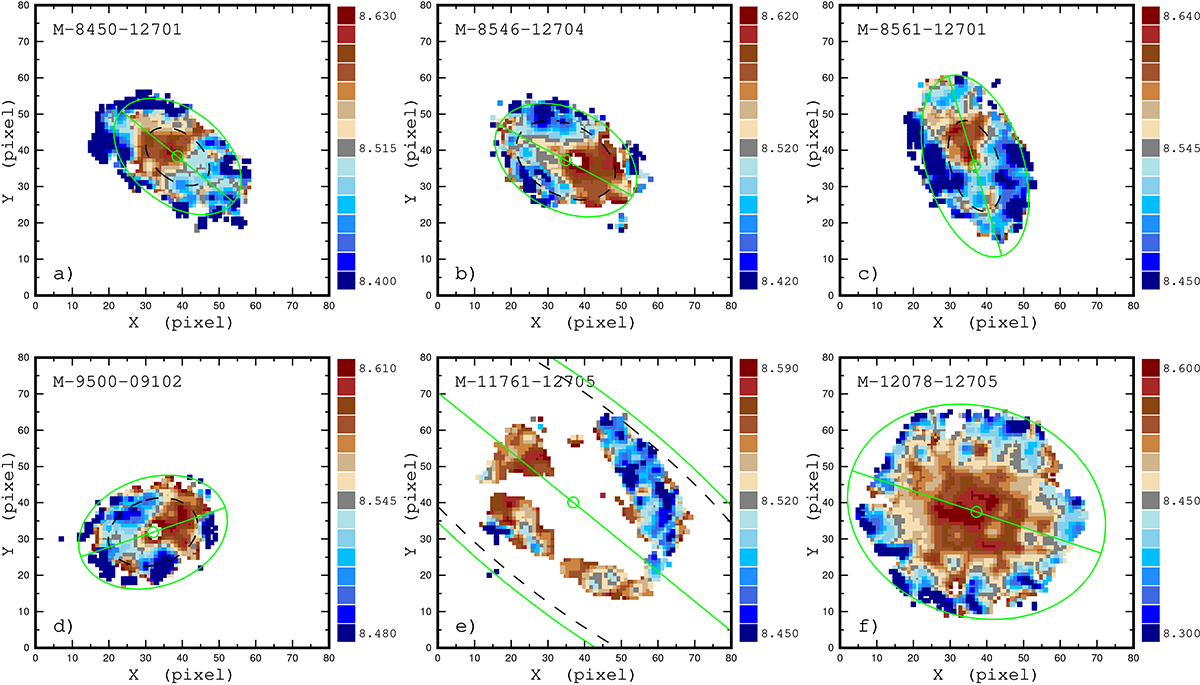
Oxygen abundance maps for our sample of selected target MaNGA galaxies with azimuthal asymmetry in the abundance distribution across the galaxy and control galaxy. Each panel shows the distribution of the oxygen abundance across the image of the galaxy in sky coordinates (pixels). The value of the oxygen abundance in the spaxel is colour-coded. The circle shows the kinematic centre of the galaxy, the line indicates the position of the major kinematic axis of the galaxy, and the solid ellipse is the optical radius. The dashed ellipse shows the area considered in the current study. Panelsa, b, c, d, and e show the target galaxies; panelf displays the control galaxy.
Current usage metrics show cumulative count of Article Views (full-text article views including HTML views, PDF and ePub downloads, according to the available data) and Abstracts Views on Vision4Press platform.
Data correspond to usage on the plateform after 2015. The current usage metrics is available 48-96 hours after online publication and is updated daily on week days.
Initial download of the metrics may take a while.