Fig. 2.
Download original image
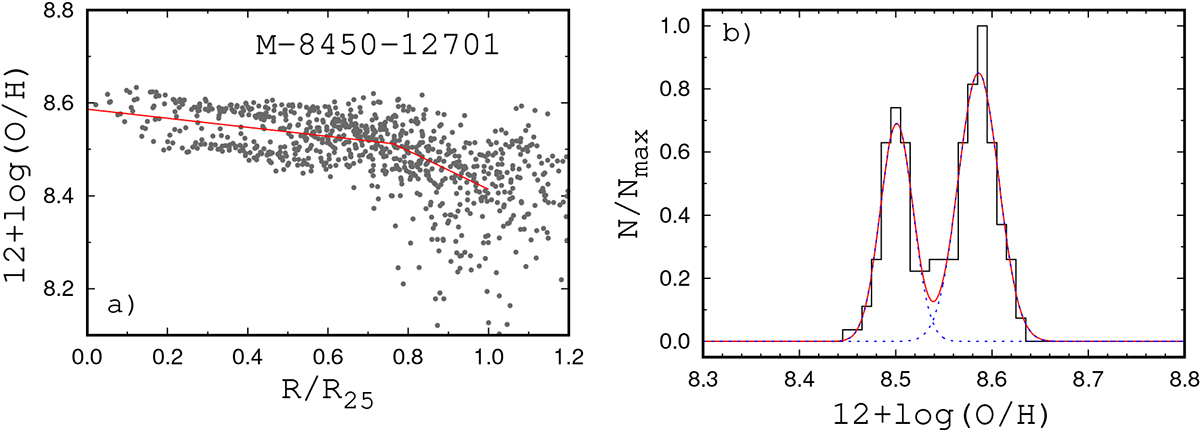
Oxygen abundance in galaxy M-8450-12701. Panela: Oxygen abundance in individual spaxel determined using R calibration from Pilyugin & Grebel (2016) as a function of radius (points). The line shows the broken linear relation for the radial abundance distribution within optical radius. Panelb: Normalised histogram of oxygen abundances for spaxels within the region of distinct azimuthal asymmetry (< 0.5 R25 for this galaxy). The solid line denotes the histogram of the obtained oxygen abundances. The dashed red curve corresponds to the fit by two Gaussians to those data, the blue dotted curves show individual Gaussians.
Current usage metrics show cumulative count of Article Views (full-text article views including HTML views, PDF and ePub downloads, according to the available data) and Abstracts Views on Vision4Press platform.
Data correspond to usage on the plateform after 2015. The current usage metrics is available 48-96 hours after online publication and is updated daily on week days.
Initial download of the metrics may take a while.