Fig. 11.
Download original image
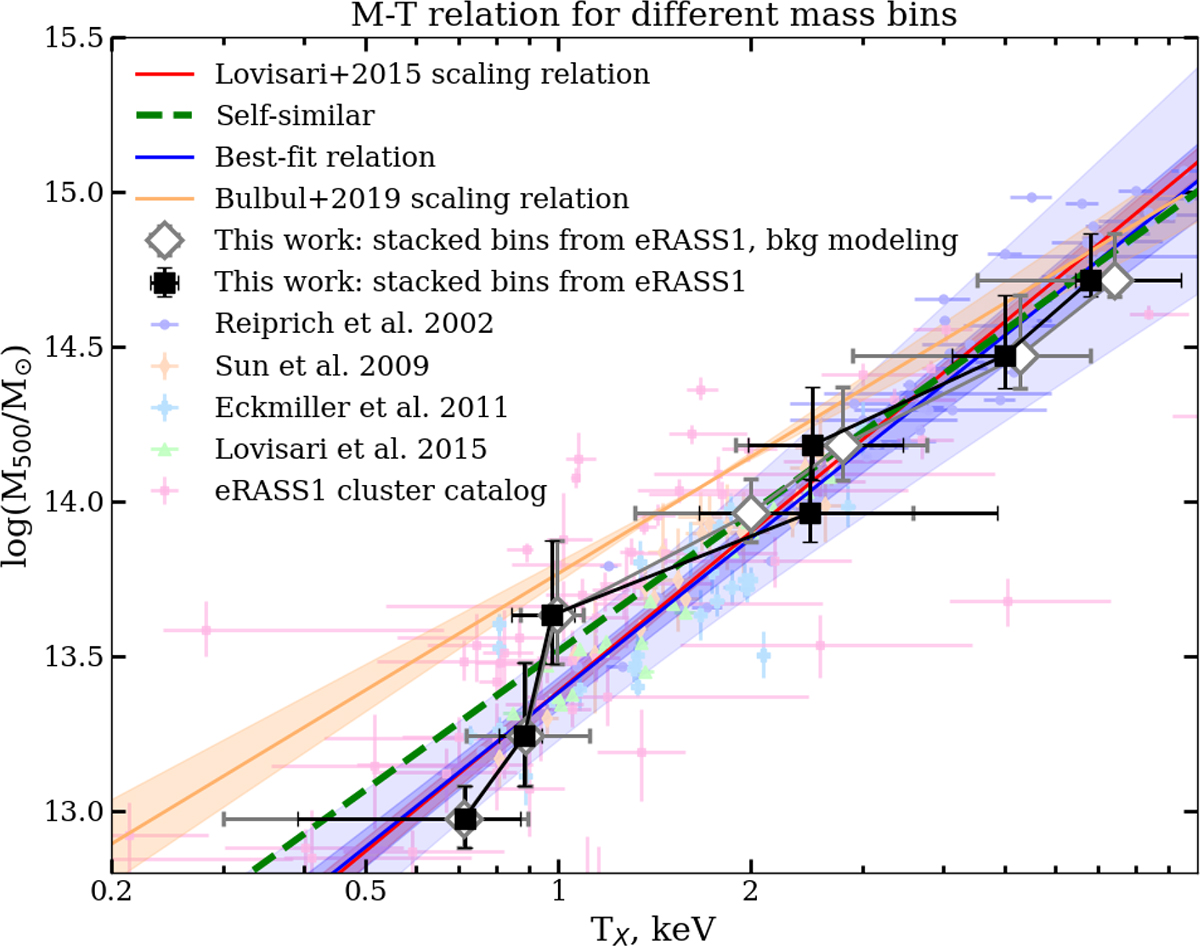
The mass-temperature relation for galaxy groups and clusters in observations, with mass defined inside R500 as a function of X-ray temperature. Black squares correspond to stacked bins from eRASS1 observations. Open diamonds represent background modeling instead of background subtraction. The red line shows the scaling relation from (Lovisari et al. 2015), the orange line represents the relation from (Bulbul et al. 2019), and the green dashed line indicates the self-similar model. The blue line corresponds to the best-fit relation. Shaded regions indicate the 1σ and 3σ confidence intervals for the respective relations.
Current usage metrics show cumulative count of Article Views (full-text article views including HTML views, PDF and ePub downloads, according to the available data) and Abstracts Views on Vision4Press platform.
Data correspond to usage on the plateform after 2015. The current usage metrics is available 48-96 hours after online publication and is updated daily on week days.
Initial download of the metrics may take a while.