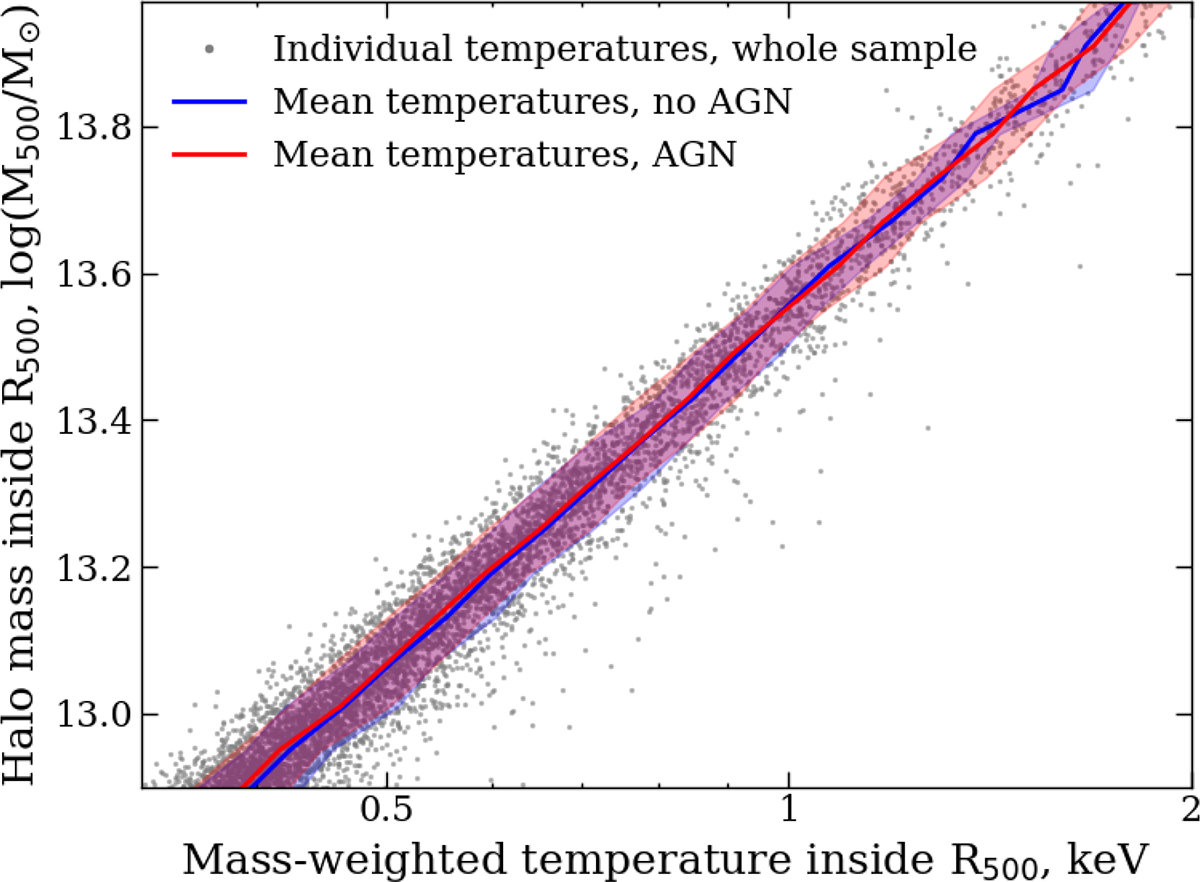
Fig. 13.
Download original image
Comparison of the mean mass-weighted temperature as a function of halo masses for a sample of groups with and without X-ray AGN sources within their R500. Grey points represent the individual mass-weighted temperatures for each source. The blue line indicates the mean temperature for the group without point sources from the mock catalog within their R500, while the red line shows the mean for groups containing such sources. Shaded areas show the standard deviation of the mean values. All sources, along with their masses and temperatures, are derived from the MAGNETICUM lightcone.
Current usage metrics show cumulative count of Article Views (full-text article views including HTML views, PDF and ePub downloads, according to the available data) and Abstracts Views on Vision4Press platform.
Data correspond to usage on the plateform after 2015. The current usage metrics is available 48-96 hours after online publication and is updated daily on week days.
Initial download of the metrics may take a while.