Open Access
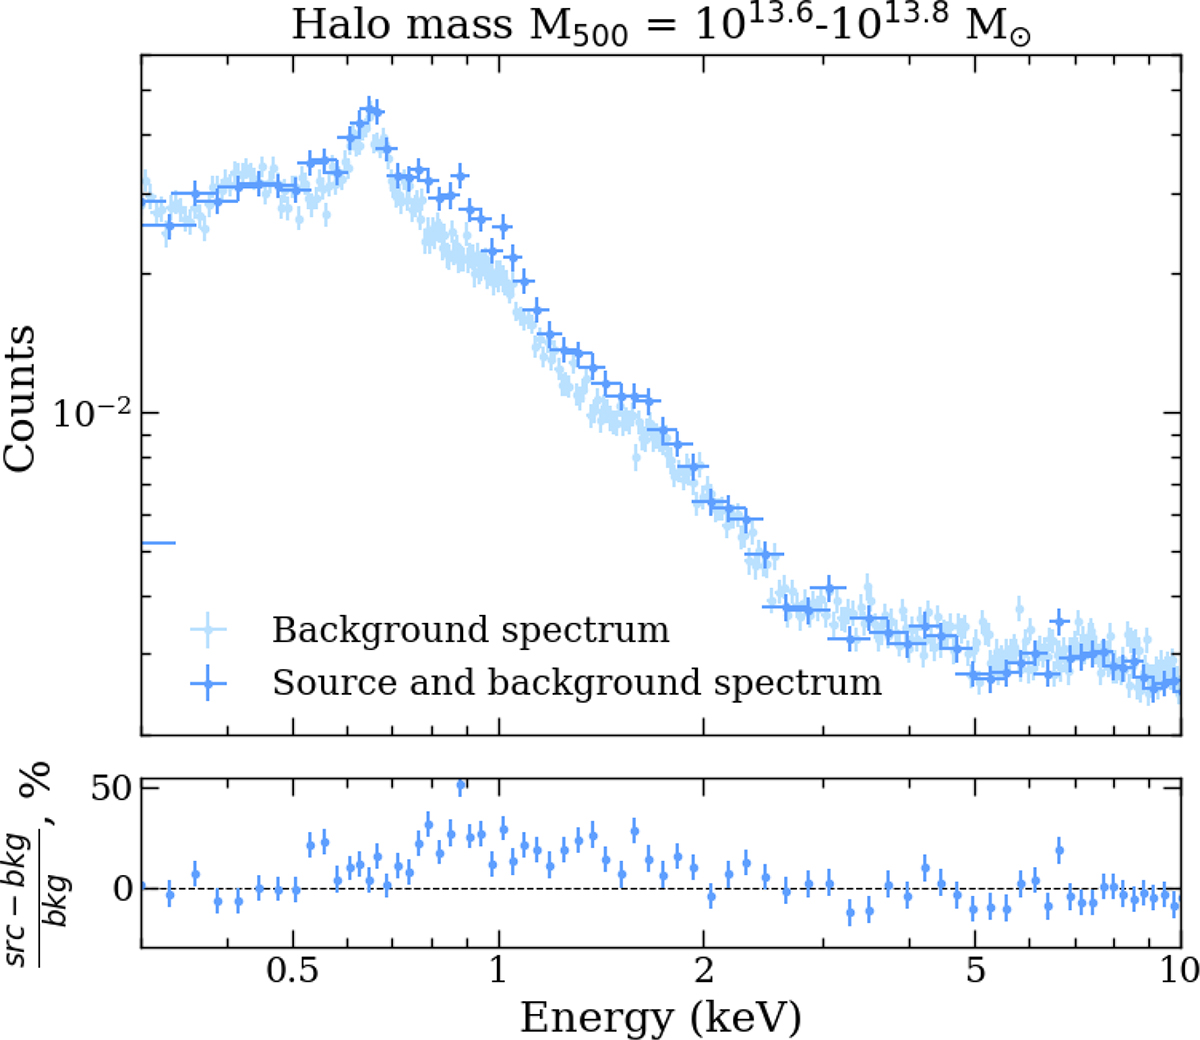
Fig. A.1.
Download original image
Comparison of the source spectrum before background subtraction (dark blue) and the background spectrum (light blue) for one of the mass bins with masses ranging from 1013.6 to 1013.8 M⊙. The visible differences in the 0.7–2 keV energy range highlight the contribution of the source emission.
Current usage metrics show cumulative count of Article Views (full-text article views including HTML views, PDF and ePub downloads, according to the available data) and Abstracts Views on Vision4Press platform.
Data correspond to usage on the plateform after 2015. The current usage metrics is available 48-96 hours after online publication and is updated daily on week days.
Initial download of the metrics may take a while.