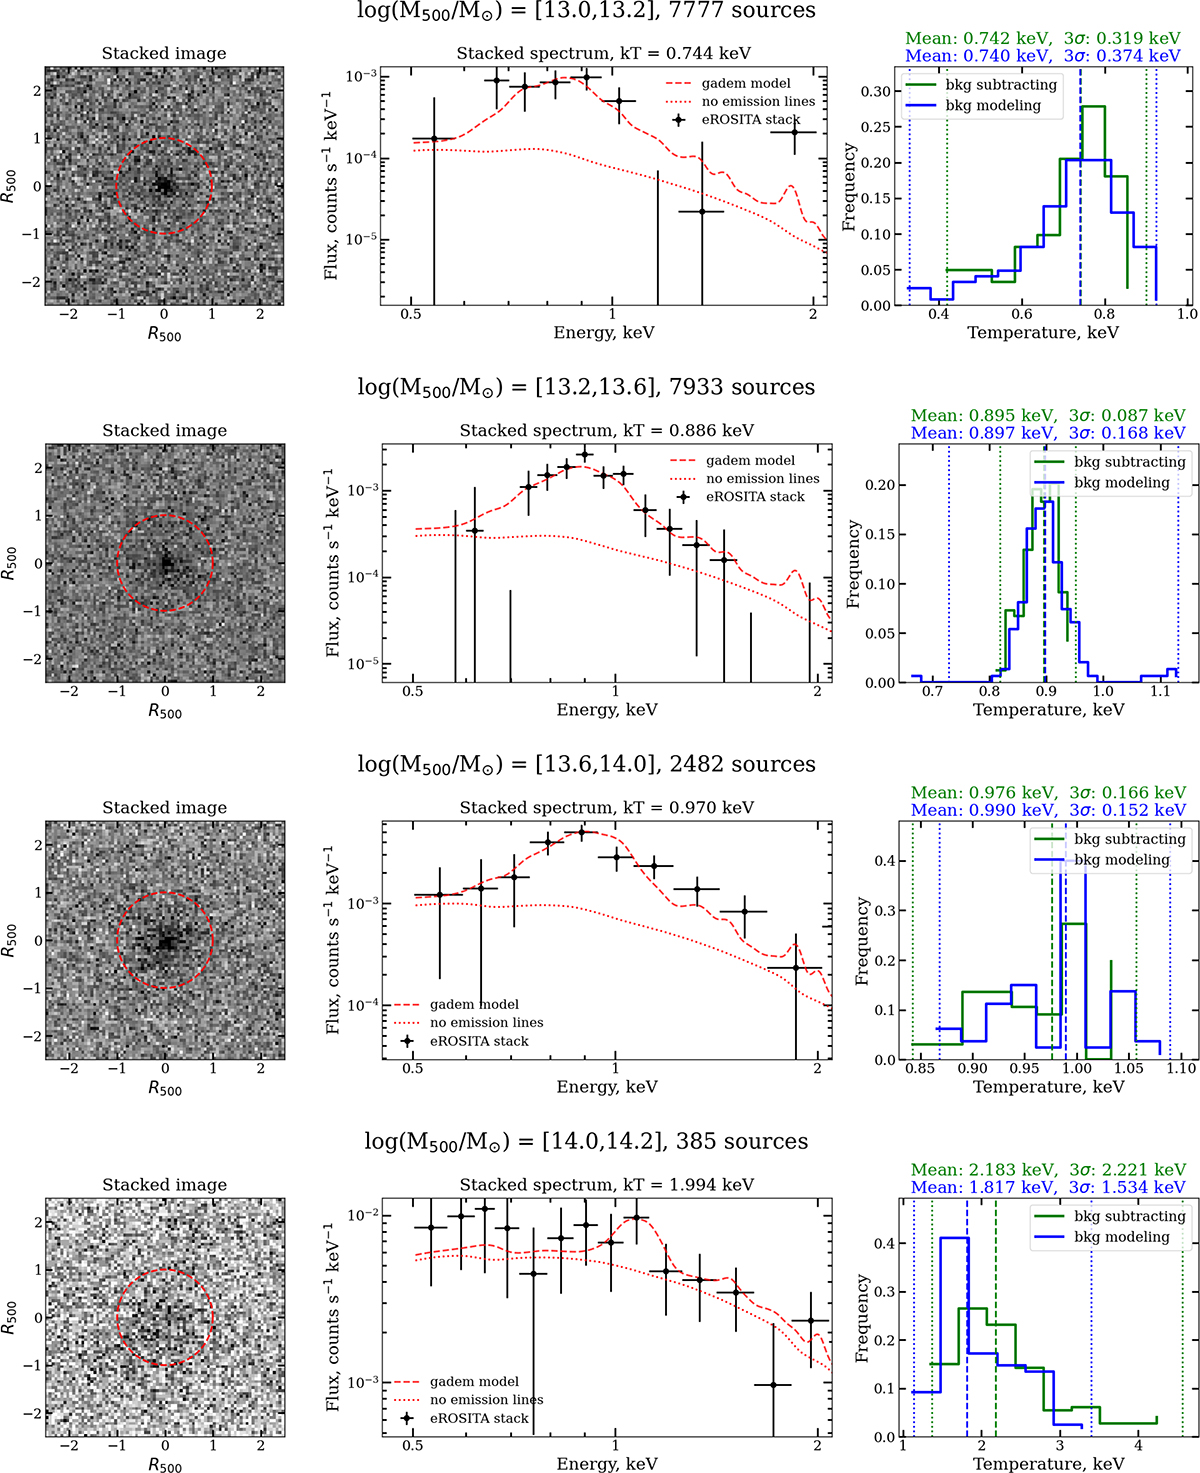
Fig. A.2.
Download original image
Left panel: Event lists scaled to R500 and stacked on the coordinates of each source from the sample described in Section 2. The red circle indicates R500. Central panel: Stacked spectrum in the 0.5–2 keV energy range. The fit using GADEM with the mean temperature provided in the title is shown by the red dashed line. Right panel: Histograms of temperatures from the bootstrapping analysis with background subtraction (green) and background modeling (blue). The title displays the mean temperature and the 3σ deviation for the background modeling histogram.
Current usage metrics show cumulative count of Article Views (full-text article views including HTML views, PDF and ePub downloads, according to the available data) and Abstracts Views on Vision4Press platform.
Data correspond to usage on the plateform after 2015. The current usage metrics is available 48-96 hours after online publication and is updated daily on week days.
Initial download of the metrics may take a while.