Fig. 7.
Download original image
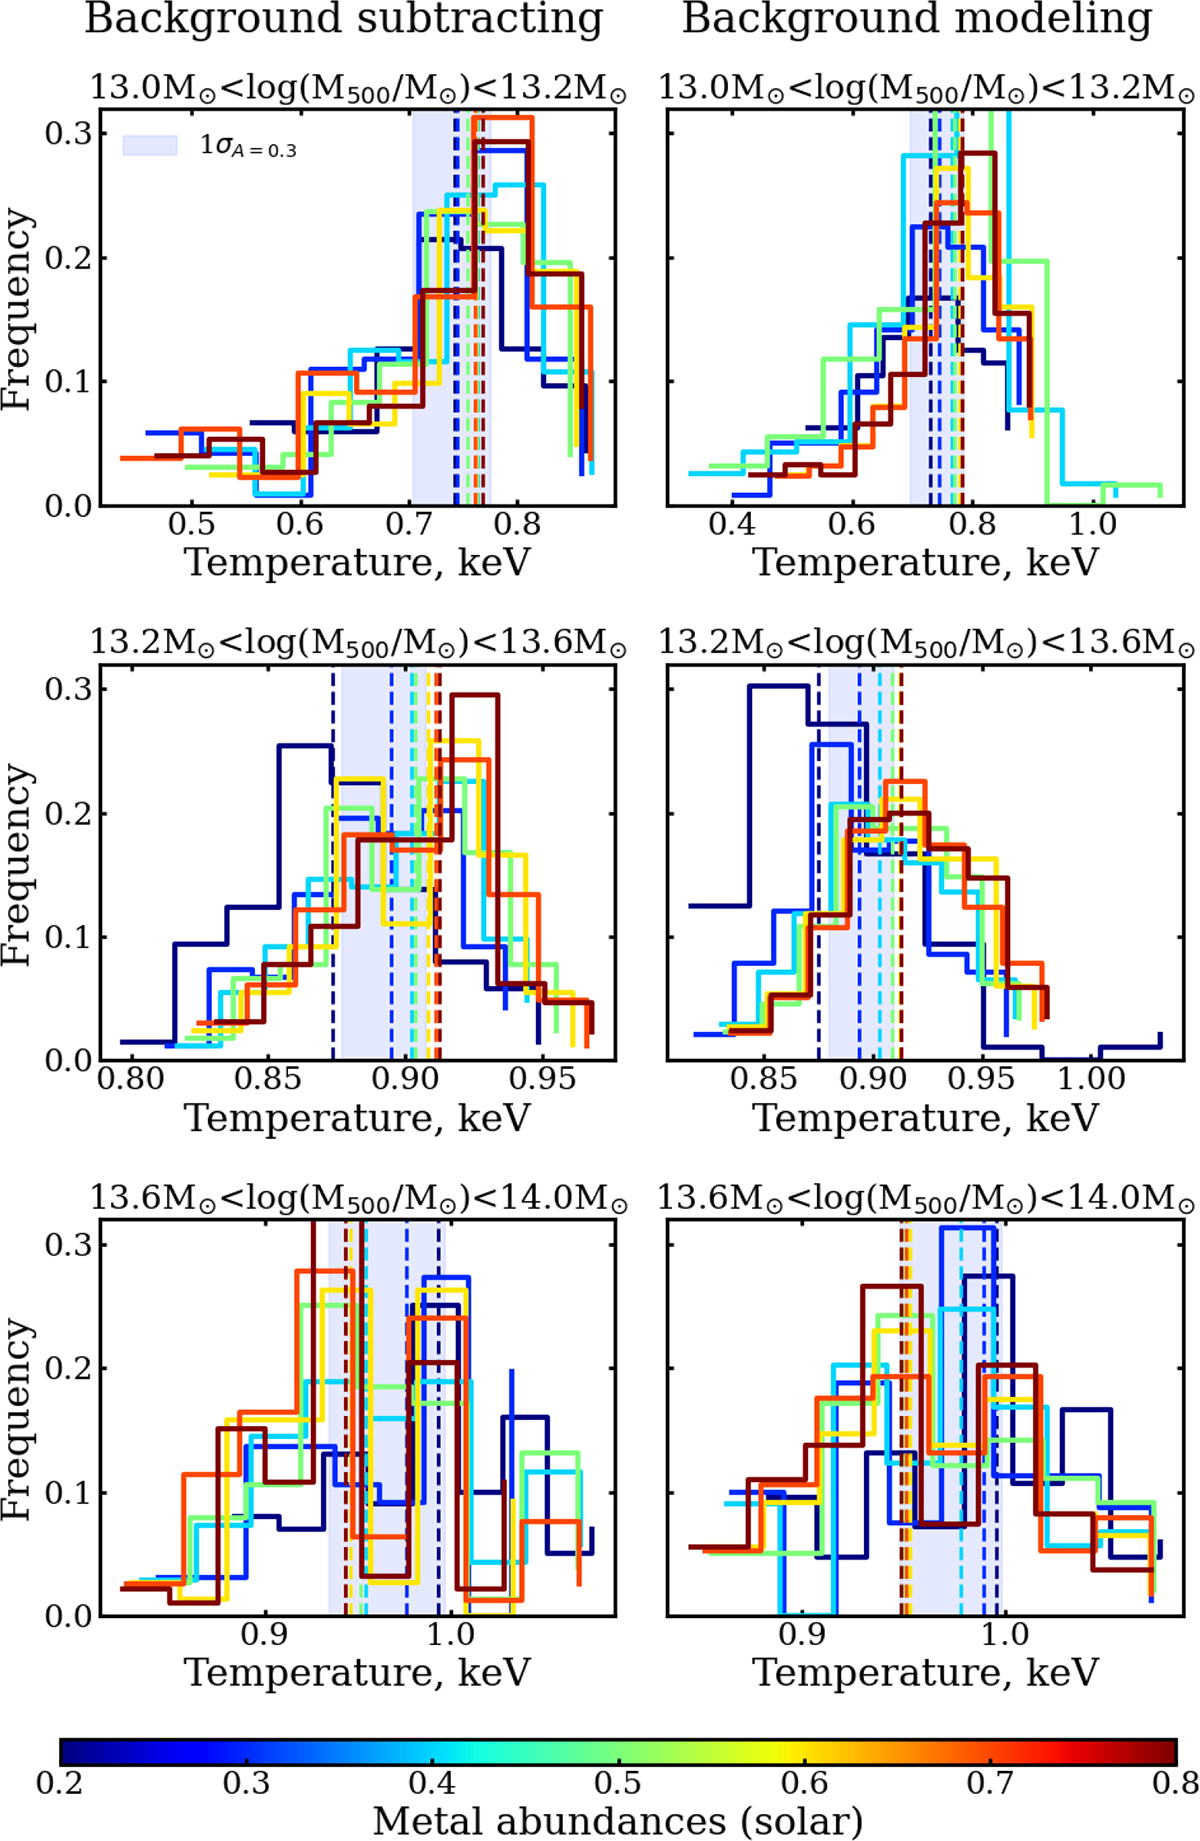
Histograms of temperature values obtained using background subtraction (left column) and background modeling (right column) across different mass bins, showing the bootstrapped error distribution. The histograms are color-coded by metal abundances. Dashed vertical lines in corresponding colors indicate the mean temperatures. The blue shaded area highlights the 1σ deviation for the abundance of 0.3 solar.
Current usage metrics show cumulative count of Article Views (full-text article views including HTML views, PDF and ePub downloads, according to the available data) and Abstracts Views on Vision4Press platform.
Data correspond to usage on the plateform after 2015. The current usage metrics is available 48-96 hours after online publication and is updated daily on week days.
Initial download of the metrics may take a while.