Fig. 9.
Download original image
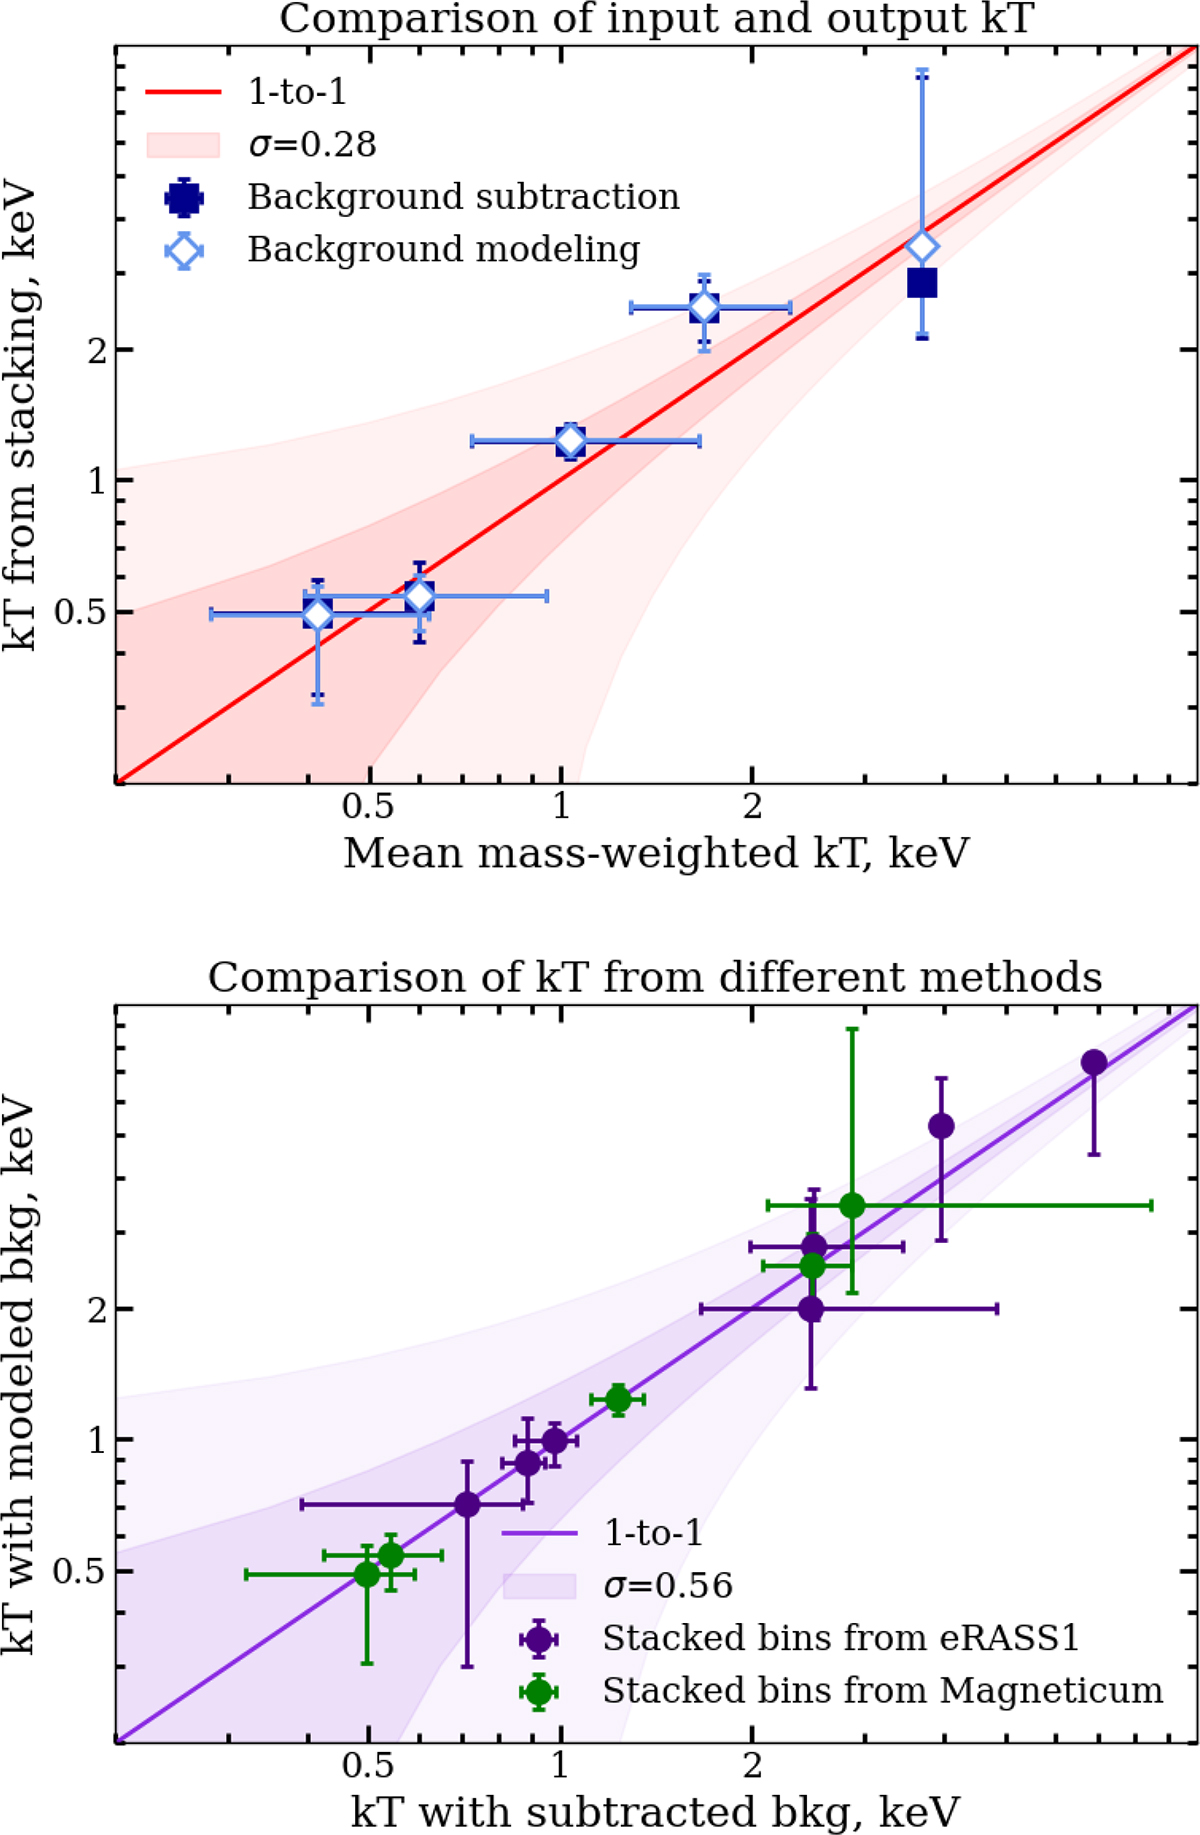
Upper panel: Comparison of temperatures derived from stacking with mean mass-weighted temperatures from simulations for the mock MAGNETICUM sample. Blue points show results from background subtraction, and black points represent results from background modeling. The red line shows the 1-to-1 relation, and the red shaded areas indicate the 1σ and 3σ error regions. Lower panel: Comparison of temperatures obtained for the observed sample (violet points) using background modeling and background subtraction methods. The red line represents the 1-to-1 relation, while the red shaded areas indicate the 1σ and 3σ error regions.
Current usage metrics show cumulative count of Article Views (full-text article views including HTML views, PDF and ePub downloads, according to the available data) and Abstracts Views on Vision4Press platform.
Data correspond to usage on the plateform after 2015. The current usage metrics is available 48-96 hours after online publication and is updated daily on week days.
Initial download of the metrics may take a while.