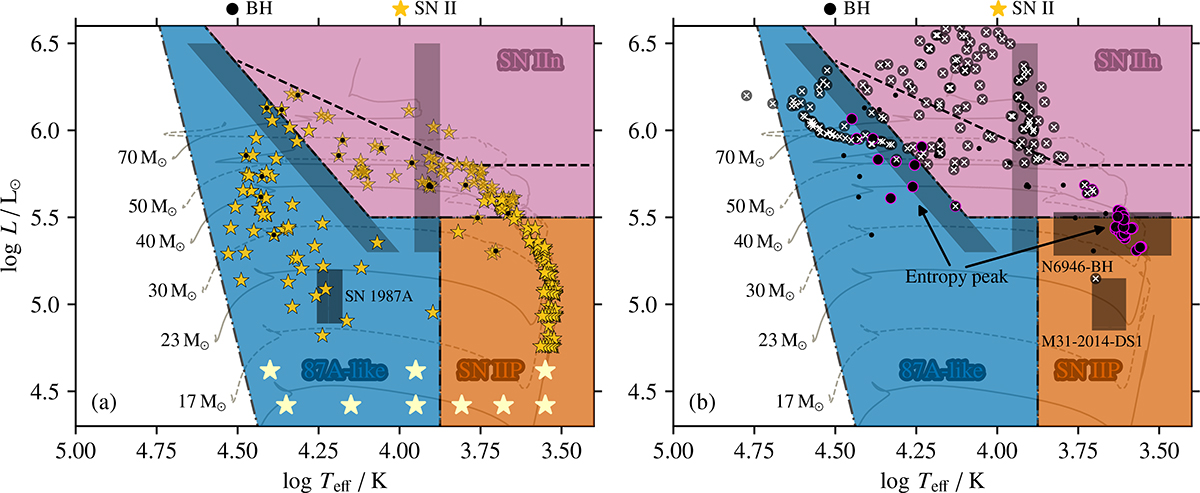
Fig. 4.
Download original image
Hertzsprung–Russell diagram of the pre-SN locations of the single star and accretor models. In the left panel a, we show models successfully exploding in SNe, while we show BH formation in the right panel b. Small black circles indicate BH formation by SN fallback and the magenta contours highlight cases of BH formation from stars in the entropy peak at MCO = 6 − 8 M⊙ (c.f. Fig. 5). The dark grey, hatched areas show the locations of the BSG progenitor of SN 1987A (left panel only) and the CSGs N6946-BH and M31-2014-DS1 that have been suggested to have collapsed into a BH (right panel only). The hot and cool regimes of the S Doradus instability strip are indicated by the light grey bands (Smith et al. 2004) and the Humphreys-Davidson limit by the black dashed line. Models slightly faded out and additionally marked by white and golden crosses spend more than 104 yr in the S Doradus region and thus likely experience significant mass loss (i.e. they will most likely explode elsewhere in the HR diagram). The reddish, blue and purple shaded areas show our ad-hoc SN classification into SN IIP, SN 1987A-like and interacting SN IIn, respectively (see main text for details). An ordering of the models into Case A, B and C accretors and the individual accretion fractions can be found in the HR diagrams in Figure 9 of Paper I.
Current usage metrics show cumulative count of Article Views (full-text article views including HTML views, PDF and ePub downloads, according to the available data) and Abstracts Views on Vision4Press platform.
Data correspond to usage on the plateform after 2015. The current usage metrics is available 48-96 hours after online publication and is updated daily on week days.
Initial download of the metrics may take a while.