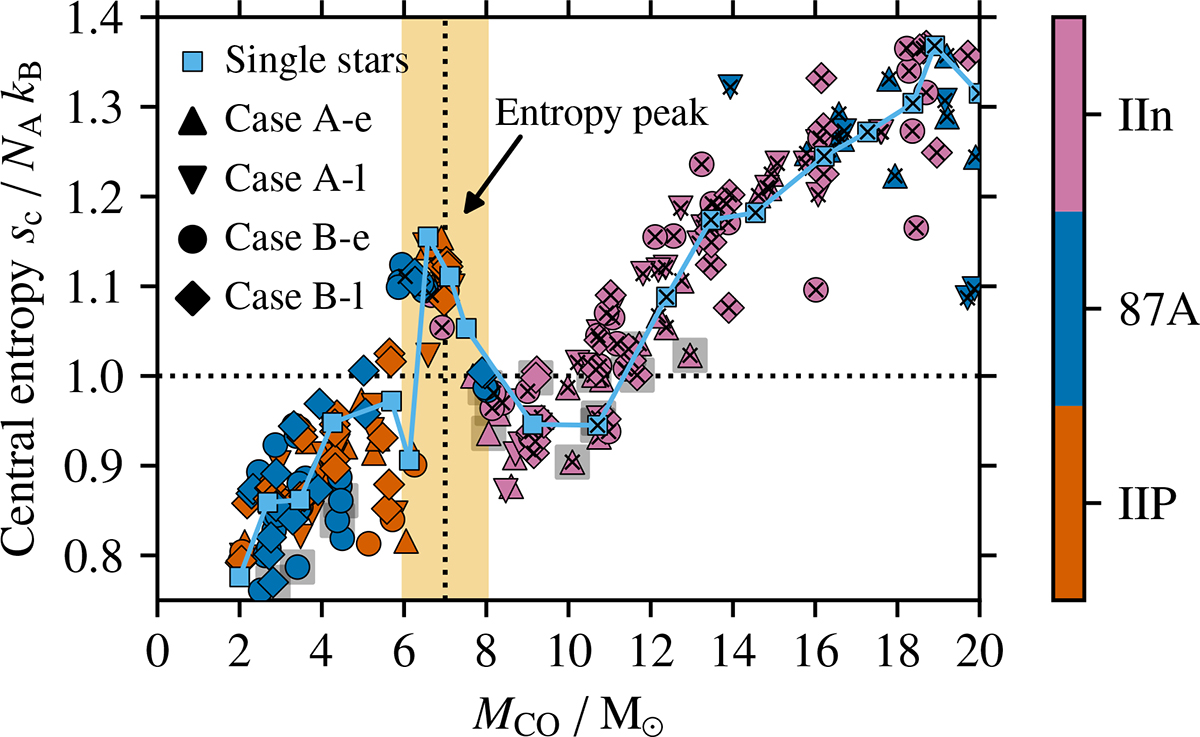
Fig. 5.
Download original image
Central specific entropy, sc, as a function of CO core mass, MCO, at core collapse for the single-star and Case A and B accretor models. The Case C accretors are not shown to enhance the clarity of the diagram. The entropy peak at MCO ≈ 6 − 8 M⊙ associated with BH formation is indicated by the yellow box. Colours relate the models to their pre-SN location in the HR diagram and hence their likely appearance as SN IIn, SN IIP, and SN 1987A-like. The horizontal and vertical black dotted lines help to visually distinguish between the different SN groups and the typical central entropies that models in these groups have at core collapse. The black crosses indicate models that likely experience significant LBV-like mass loss, and grey boxes show cases of likely SN fallback.
Current usage metrics show cumulative count of Article Views (full-text article views including HTML views, PDF and ePub downloads, according to the available data) and Abstracts Views on Vision4Press platform.
Data correspond to usage on the plateform after 2015. The current usage metrics is available 48-96 hours after online publication and is updated daily on week days.
Initial download of the metrics may take a while.