Fig. 10.
Download original image
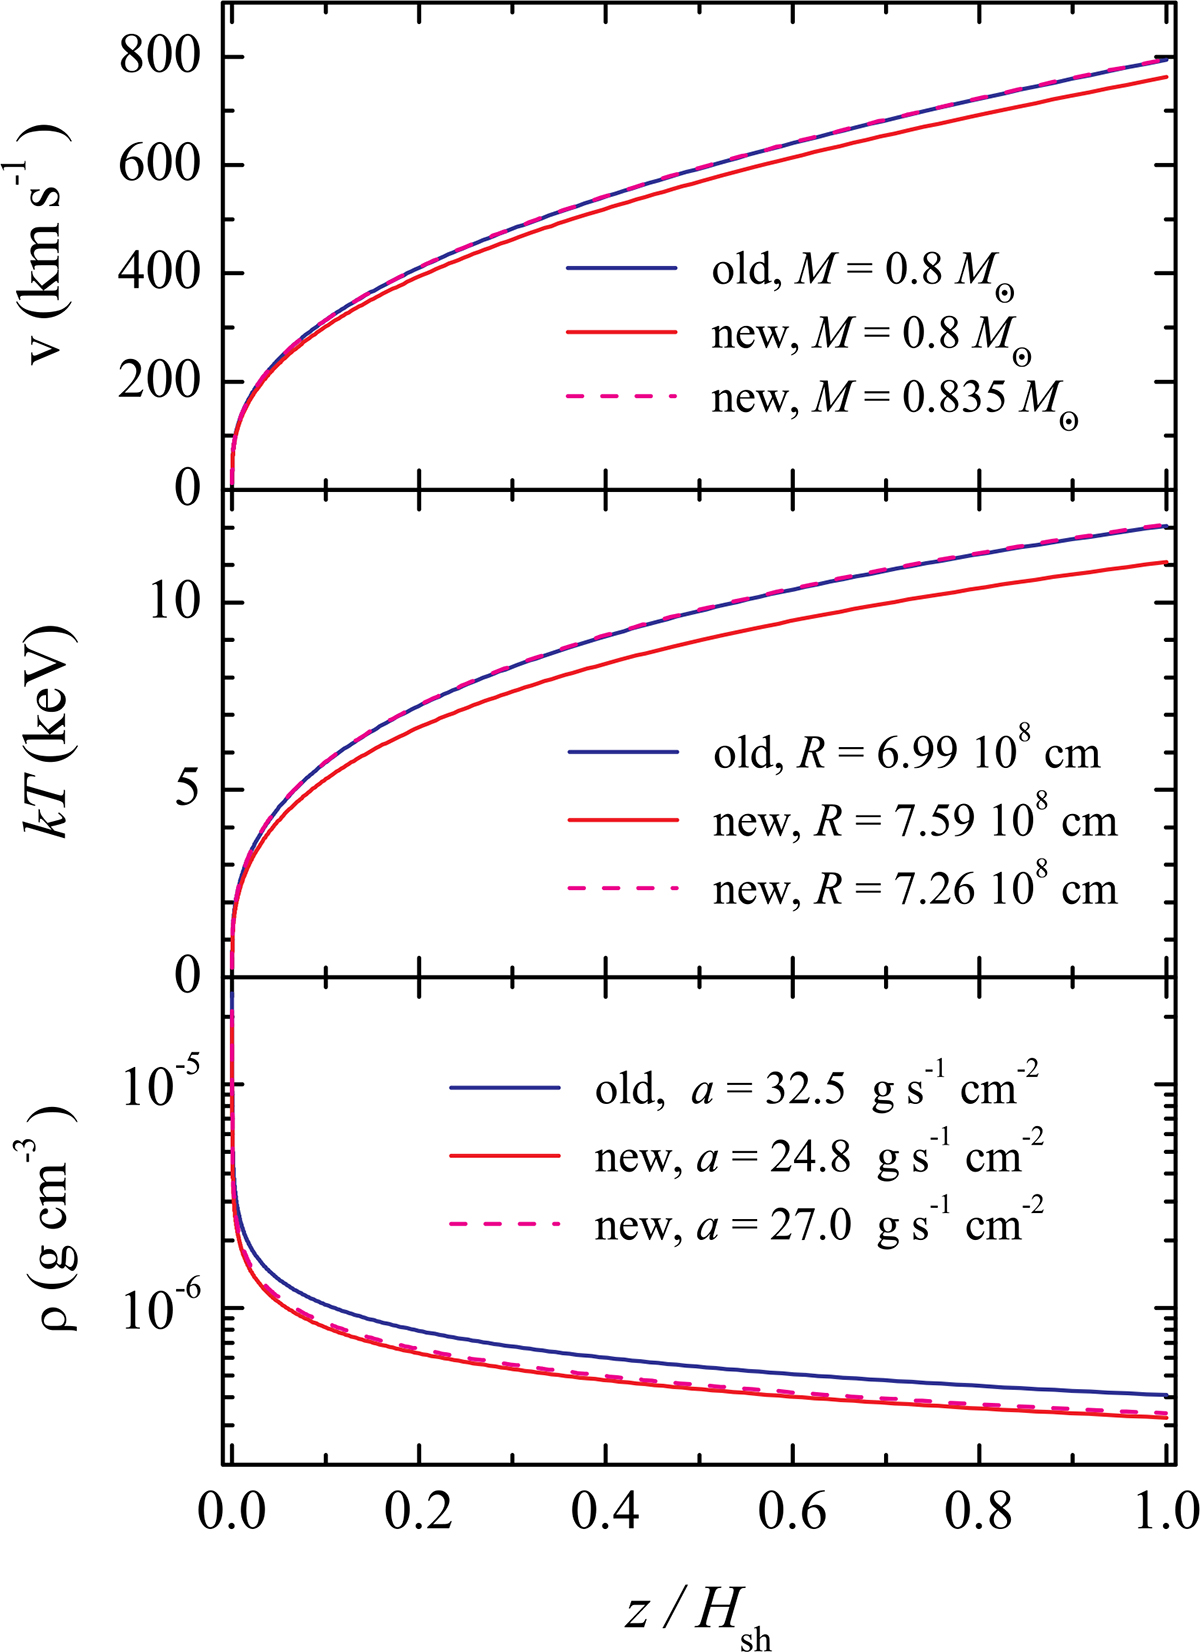
Comparison of velocity, v, temperature, T, and plasma density, ρ in the PSR models computed using the old (blue curves, Suleimanov et al. 2016) and the new (red curves) methods for M = 0.8 M⊙ and rm = 1.5. The distributions for the new model with the increased M = 0.835 M⊙, whose spectrum simulates the spectrum of the old model, are also shown with dashed magenta curves. Parameters of the models are shown in the panels. The shock heights Hsh are 4.51 × 105 cm, 3.94 × 105 cm, and 4.77×105 cm for the new, old, and new (M = 0.835 M⊙) models, respectively.
Current usage metrics show cumulative count of Article Views (full-text article views including HTML views, PDF and ePub downloads, according to the available data) and Abstracts Views on Vision4Press platform.
Data correspond to usage on the plateform after 2015. The current usage metrics is available 48-96 hours after online publication and is updated daily on week days.
Initial download of the metrics may take a while.