Open Access
Fig. 11.
Download original image
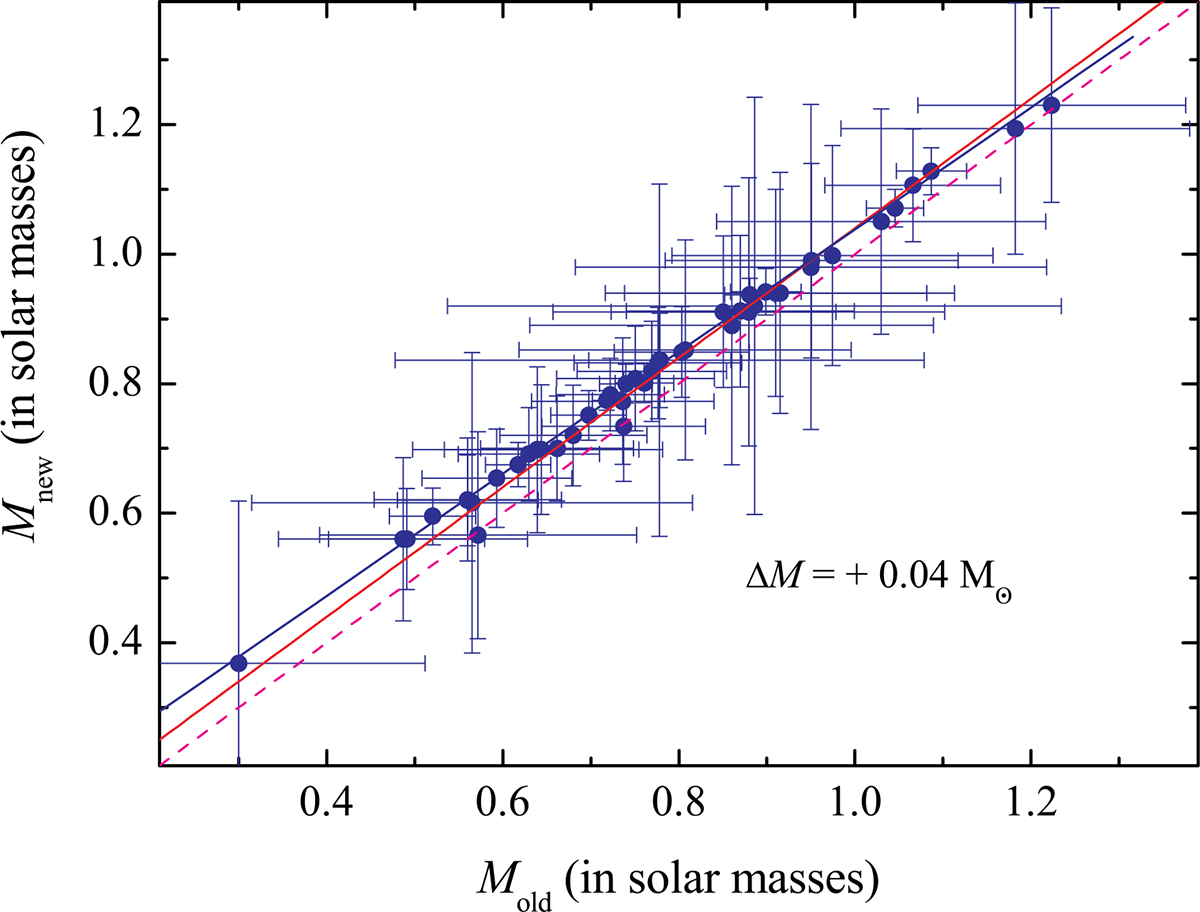
Comparison of the WD masses from the Swift/BAT sample found using the old published spectral model grid IPOLAR and the new model grid. Lines of equal masses (dashed red) and shifted to 0.04 M⊙ (solid red) are also shown. A linear fit is displayed by the blue line.
Current usage metrics show cumulative count of Article Views (full-text article views including HTML views, PDF and ePub downloads, according to the available data) and Abstracts Views on Vision4Press platform.
Data correspond to usage on the plateform after 2015. The current usage metrics is available 48-96 hours after online publication and is updated daily on week days.
Initial download of the metrics may take a while.