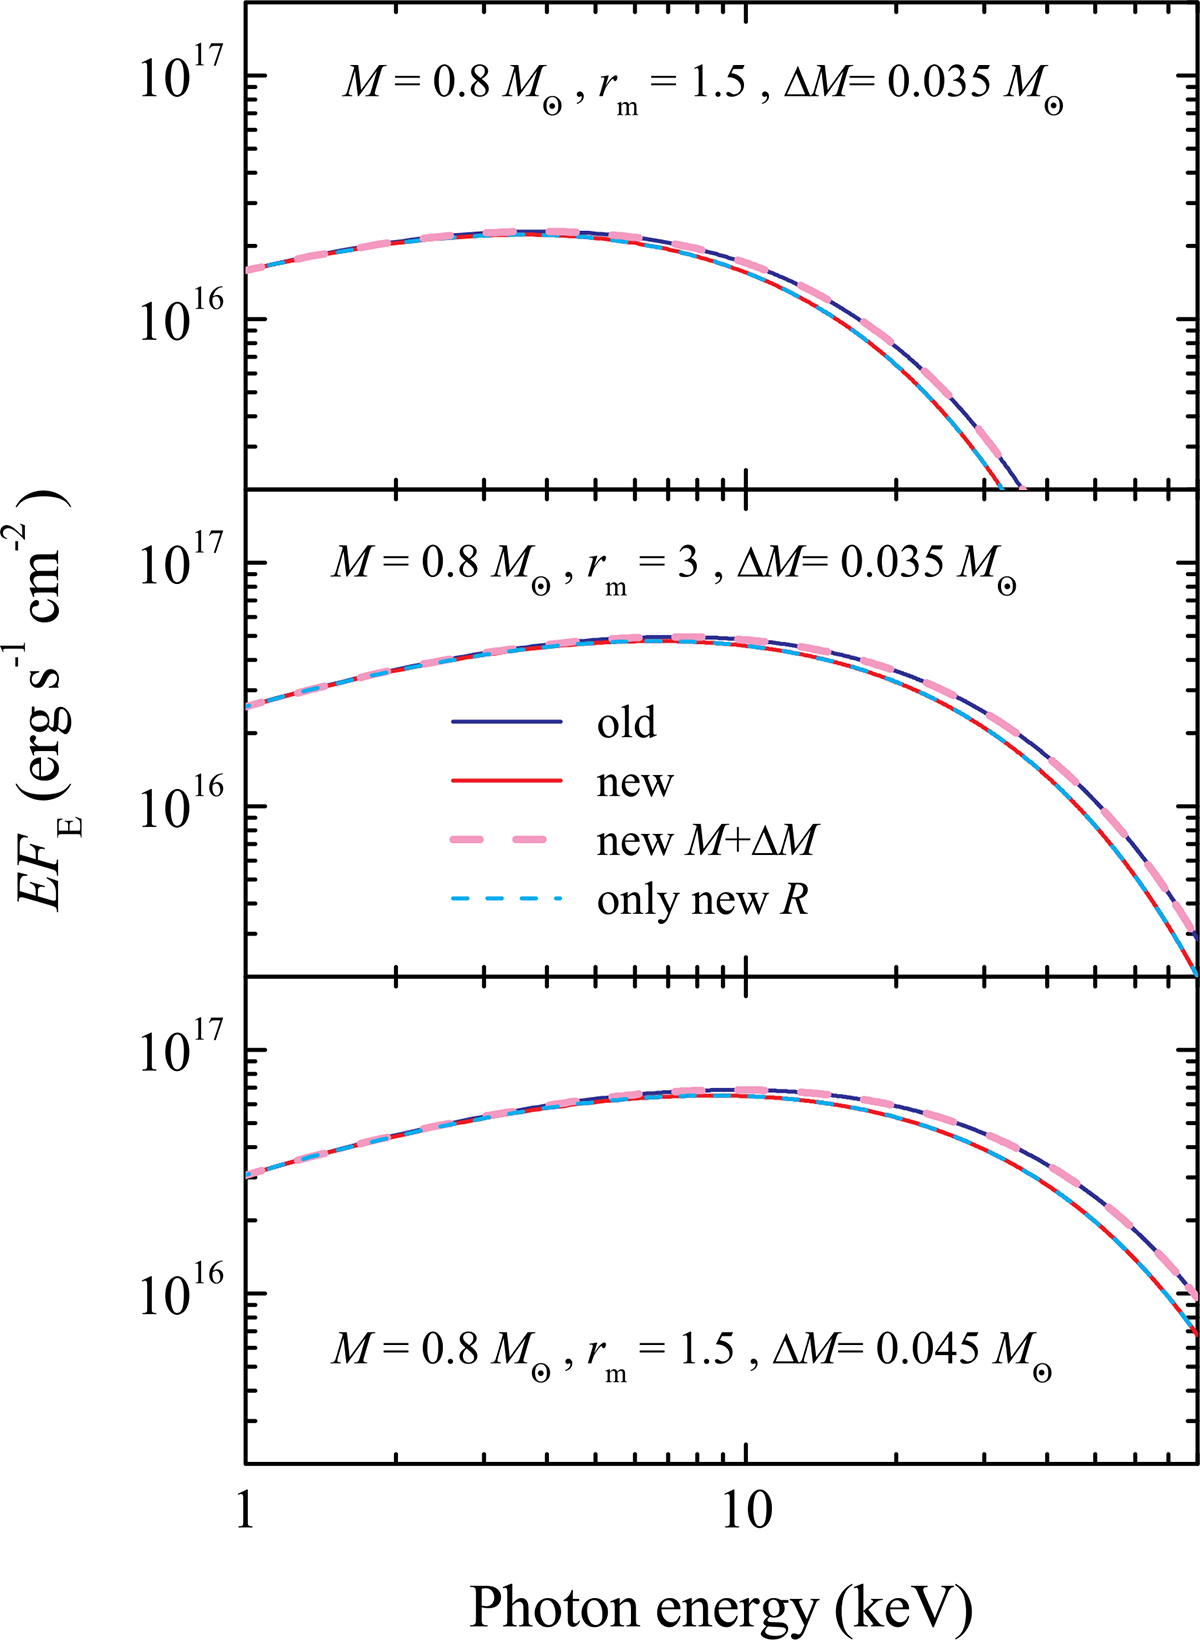
Fig. 9.
Download original image
Comparison of the model spectra computed using the old (blue curves, Suleimanov et al. 2016) and the new (red curves) methods for M = 0.8 M⊙ and rm = 1.5 (top panel), 3 (middle panel), and 10 (bottom panel). The spectra computed with the new method with the increased M, which simulate the spectra of the old models, are also shown with the dashed magenta curves (almost coincide with the blue curves). The spectra of the models with new R only are shown with the dashed cyan curves (almost coincide with the red curves). All model spectra are normalized to the old models’ flux at 1 keV.
Current usage metrics show cumulative count of Article Views (full-text article views including HTML views, PDF and ePub downloads, according to the available data) and Abstracts Views on Vision4Press platform.
Data correspond to usage on the plateform after 2015. The current usage metrics is available 48-96 hours after online publication and is updated daily on week days.
Initial download of the metrics may take a while.