Fig. 1
Download original image
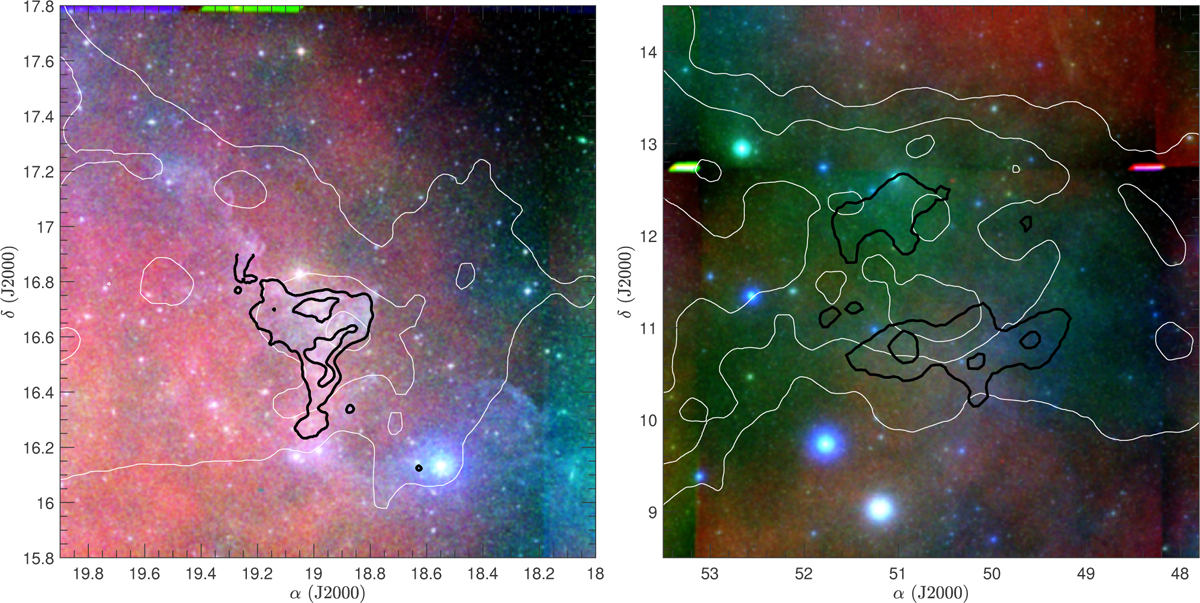
Visible composite image of MBM 03 (left panel) and MBM 16 (right panel). Visible image from DSS2 (red channel = IR filter, green channel = R filter, blue channel = B filter). Thick black contours depict the 12CO at levels of 4 and 9 K km s-1 for MBM 03, and 2 and 4 K km s-1 for MBM 16. Thin white contours portray the H I column density at levels of 100, 120, and 140 K km s-1 for MBM 03, and 230, 270, and 310 K km s-1 for MBM 16. 12CO and H I integrated intensities were calculated in the velocity range of [-10.7, -3.6] km s-1 for MBM 03, and [4.7, 9.3] km s-1 for MBM 16.
Current usage metrics show cumulative count of Article Views (full-text article views including HTML views, PDF and ePub downloads, according to the available data) and Abstracts Views on Vision4Press platform.
Data correspond to usage on the plateform after 2015. The current usage metrics is available 48-96 hours after online publication and is updated daily on week days.
Initial download of the metrics may take a while.