Fig. 10
Download original image
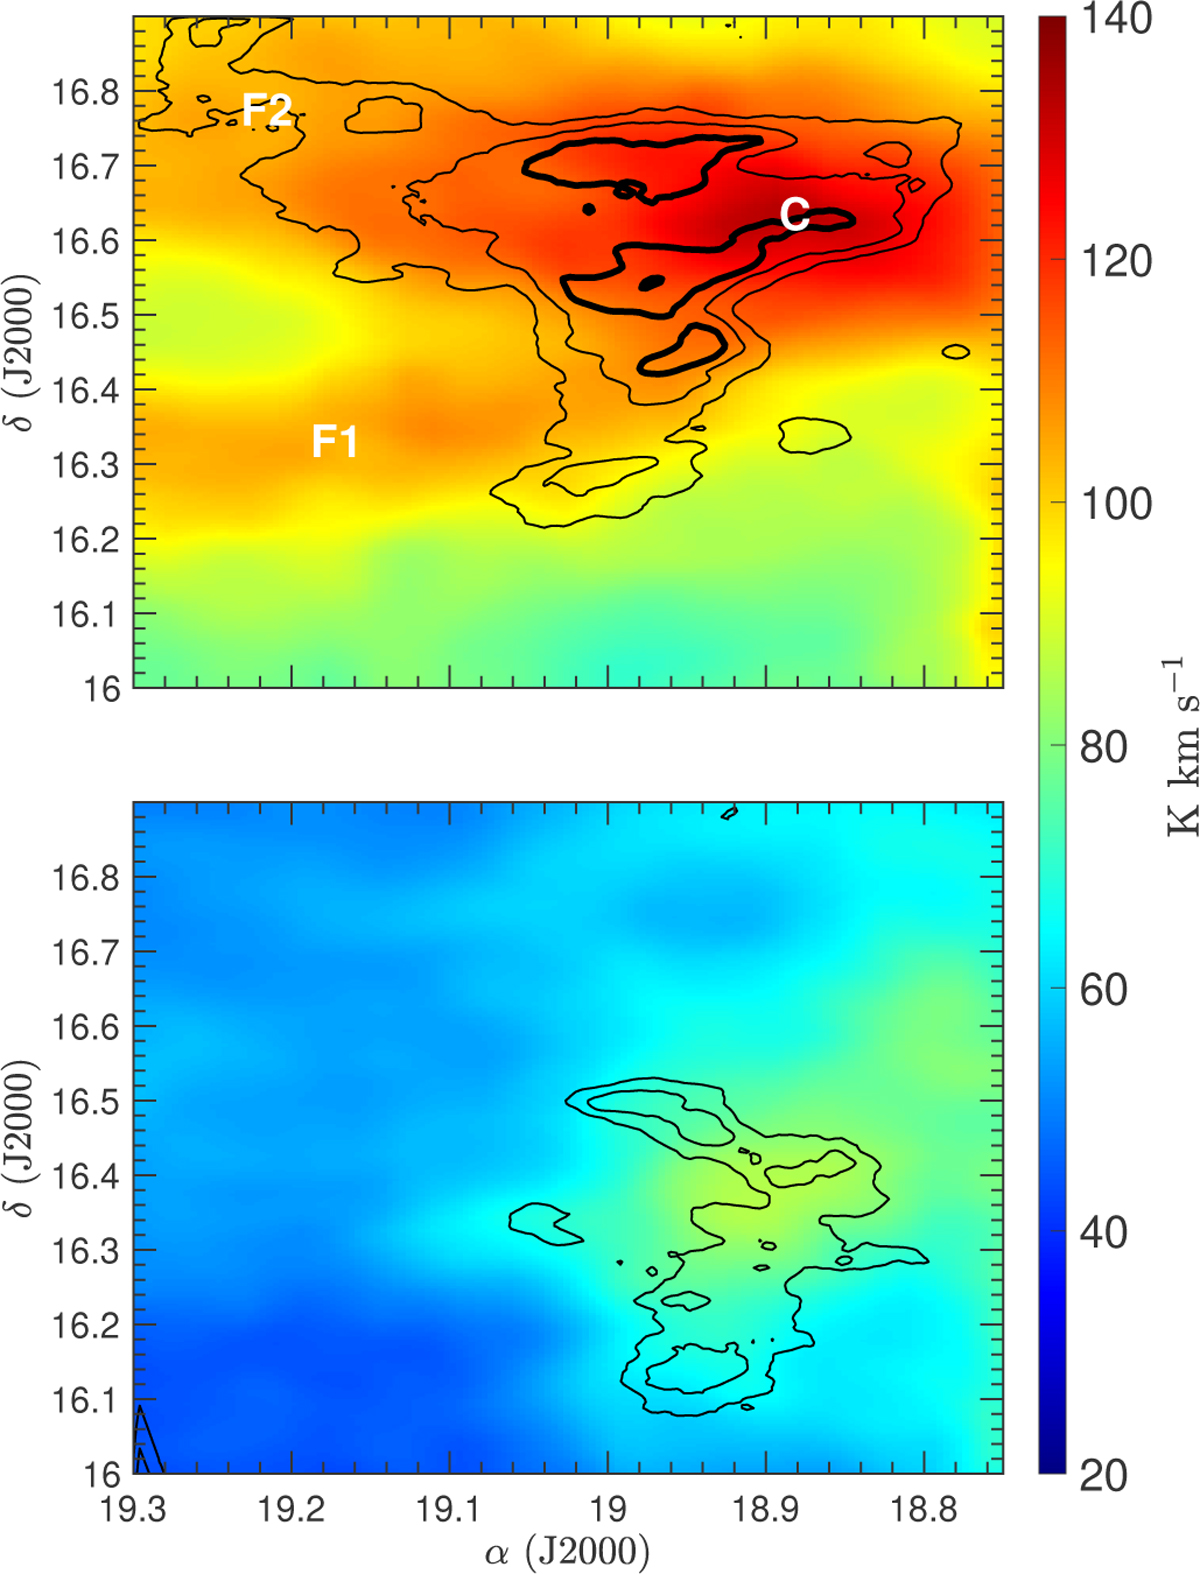
H I integrated antenna temperature for the primary cloud (top panel, integrated from -10 to -4 km s-1) and for the outlier cloud (bottom panel, integrated from -3.5 to 1 km s-1). The contours in each panel are from the 12CO, integrated on the same velocity range of HI for each cloud. The primary cloud contours are 3, 6, and 9 (thick contour) K km s-1 and the outlier cloud contours are 1.5 and 2.5 K km s-1. The H I color bar is the same in both panels. Hence, the atomic hydrogen linked with the outlier cloud is distinctly less abundant than the hydrogen associated with the primary cloud. In the top panel are reported the positions of the selected H I profiles of Figure 11. See Section 4.4 for further details.
Current usage metrics show cumulative count of Article Views (full-text article views including HTML views, PDF and ePub downloads, according to the available data) and Abstracts Views on Vision4Press platform.
Data correspond to usage on the plateform after 2015. The current usage metrics is available 48-96 hours after online publication and is updated daily on week days.
Initial download of the metrics may take a while.