Fig. 11
Download original image
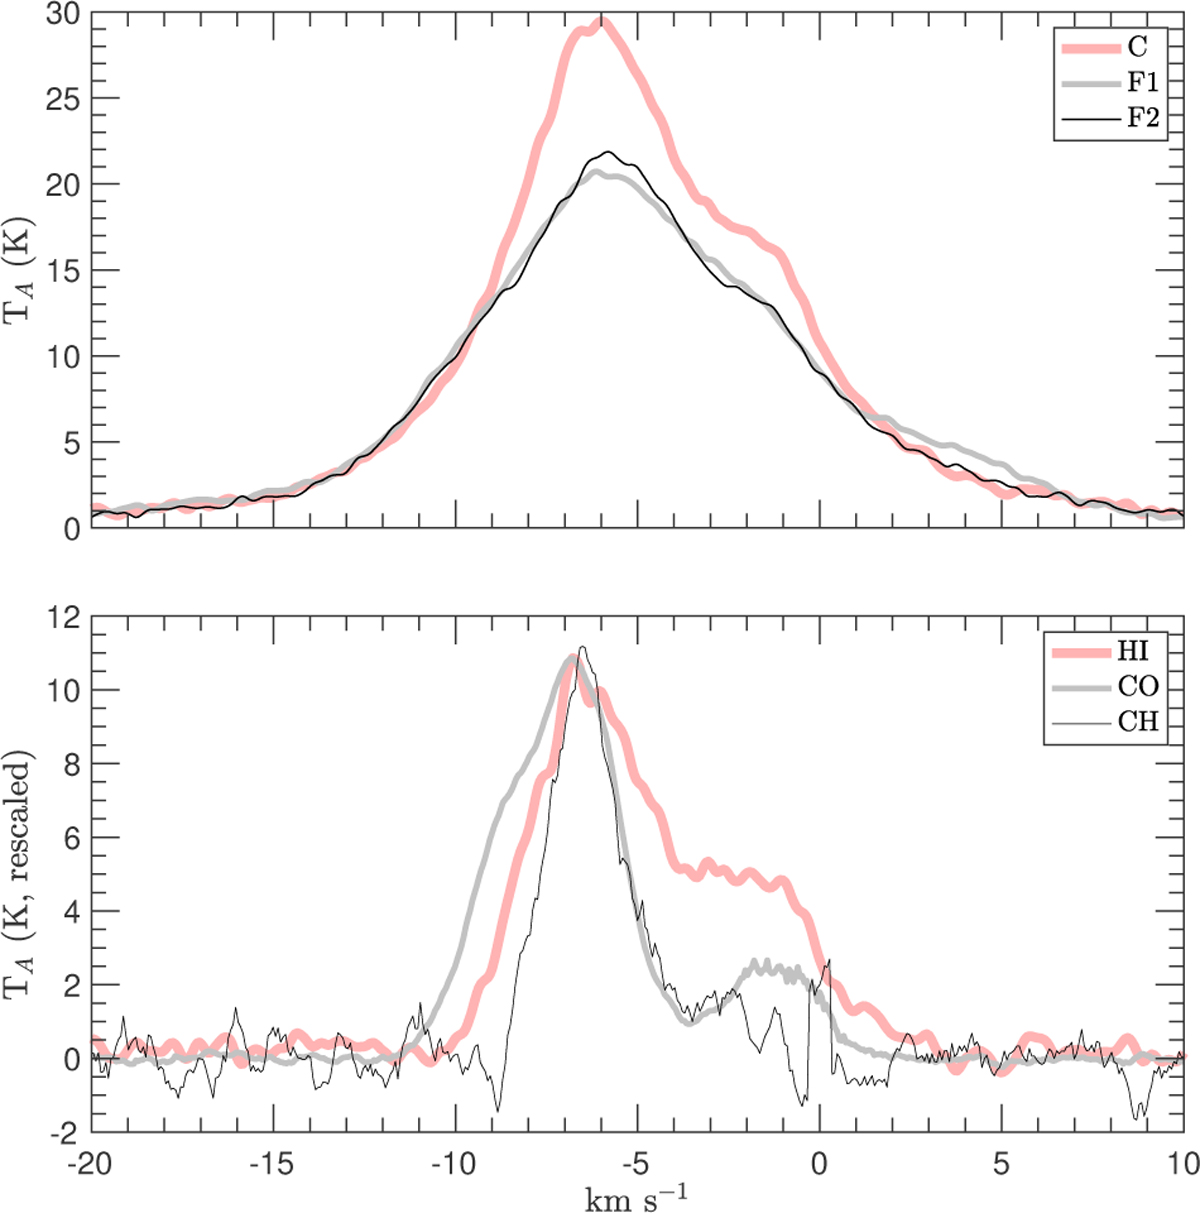
(Top panel) H I profiles for the selected positions labeled in Figure 10. F1 and F2 are located inside the candidate filaments, and the profiles are surprisingly similar, whereas the C profile is linked with the MBM 3 core. (Bottom panel) The thick pale red line is the result of subtraction between C and F1, the thick gray line is the 12CO emission averaged over the whole cloud, and the thin black line is CH. Note that the 12CO and CH are scaled to H I to better compare the line shape of atomic and molecular gas.
Current usage metrics show cumulative count of Article Views (full-text article views including HTML views, PDF and ePub downloads, according to the available data) and Abstracts Views on Vision4Press platform.
Data correspond to usage on the plateform after 2015. The current usage metrics is available 48-96 hours after online publication and is updated daily on week days.
Initial download of the metrics may take a while.