Open Access
Fig. 12
Download original image
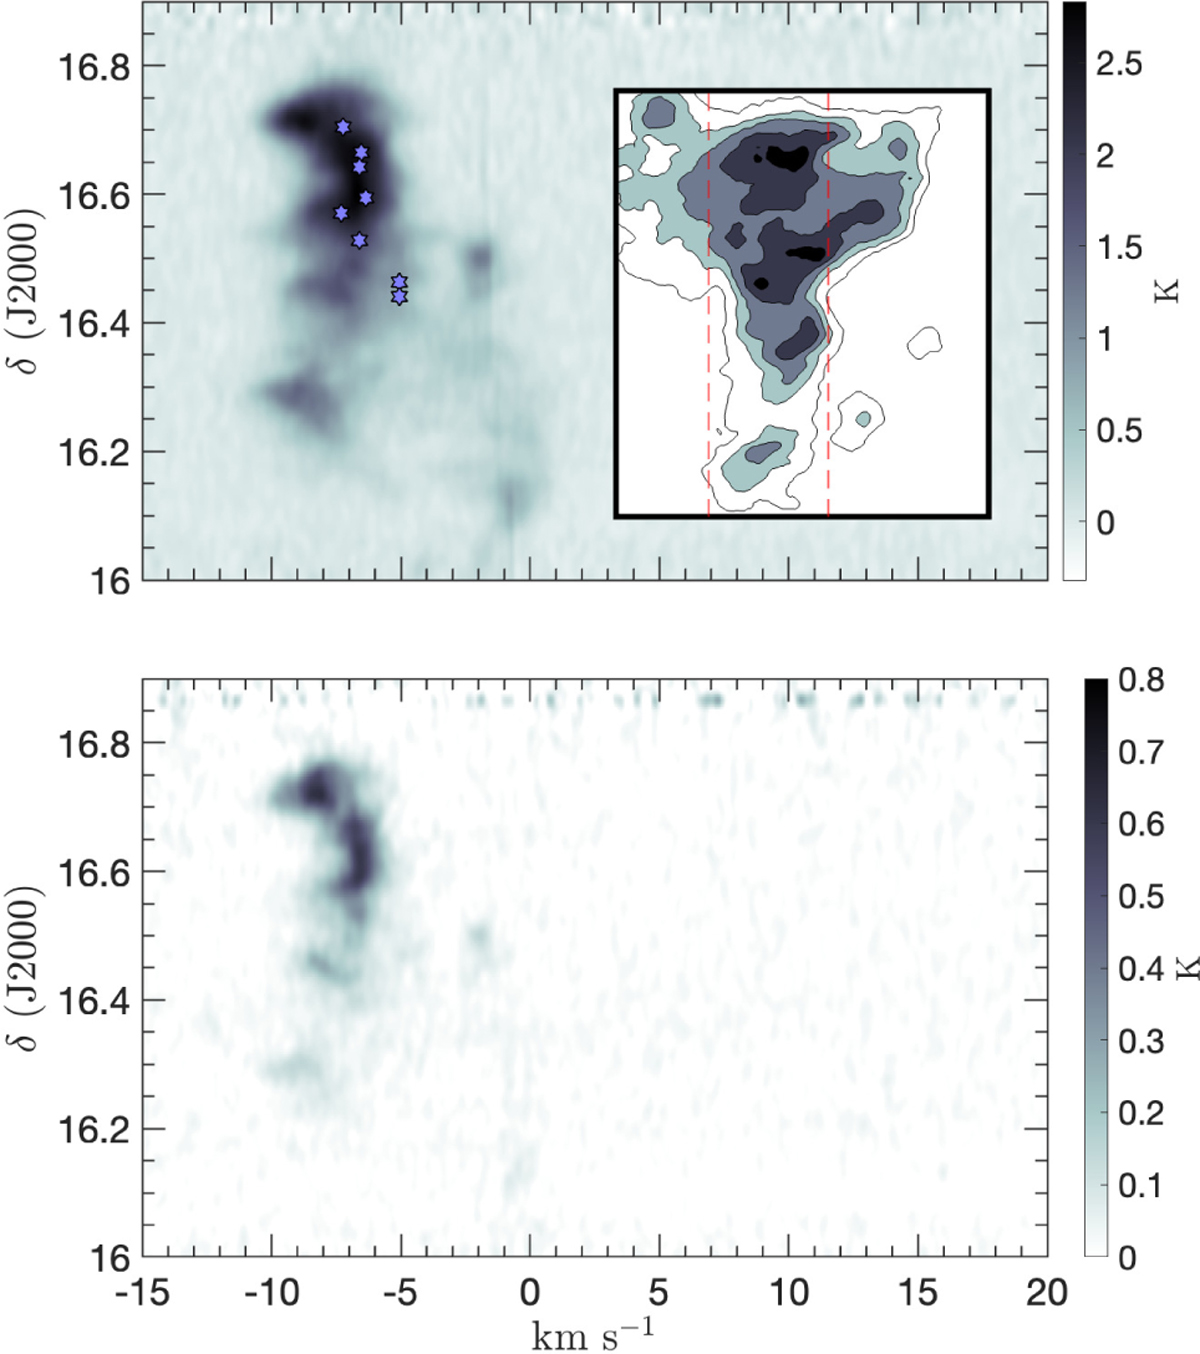
Position-velocity plot of 12CO (top panel) and 13CO (bottom panel) mean antenna temperature along declination for MBM 3. Blue stars indicate the CH velocity centroids. In the insertion we show the RA range (dashed red lines) within which the PV plot is computed.
Current usage metrics show cumulative count of Article Views (full-text article views including HTML views, PDF and ePub downloads, according to the available data) and Abstracts Views on Vision4Press platform.
Data correspond to usage on the plateform after 2015. The current usage metrics is available 48-96 hours after online publication and is updated daily on week days.
Initial download of the metrics may take a while.