Fig. 13
Download original image
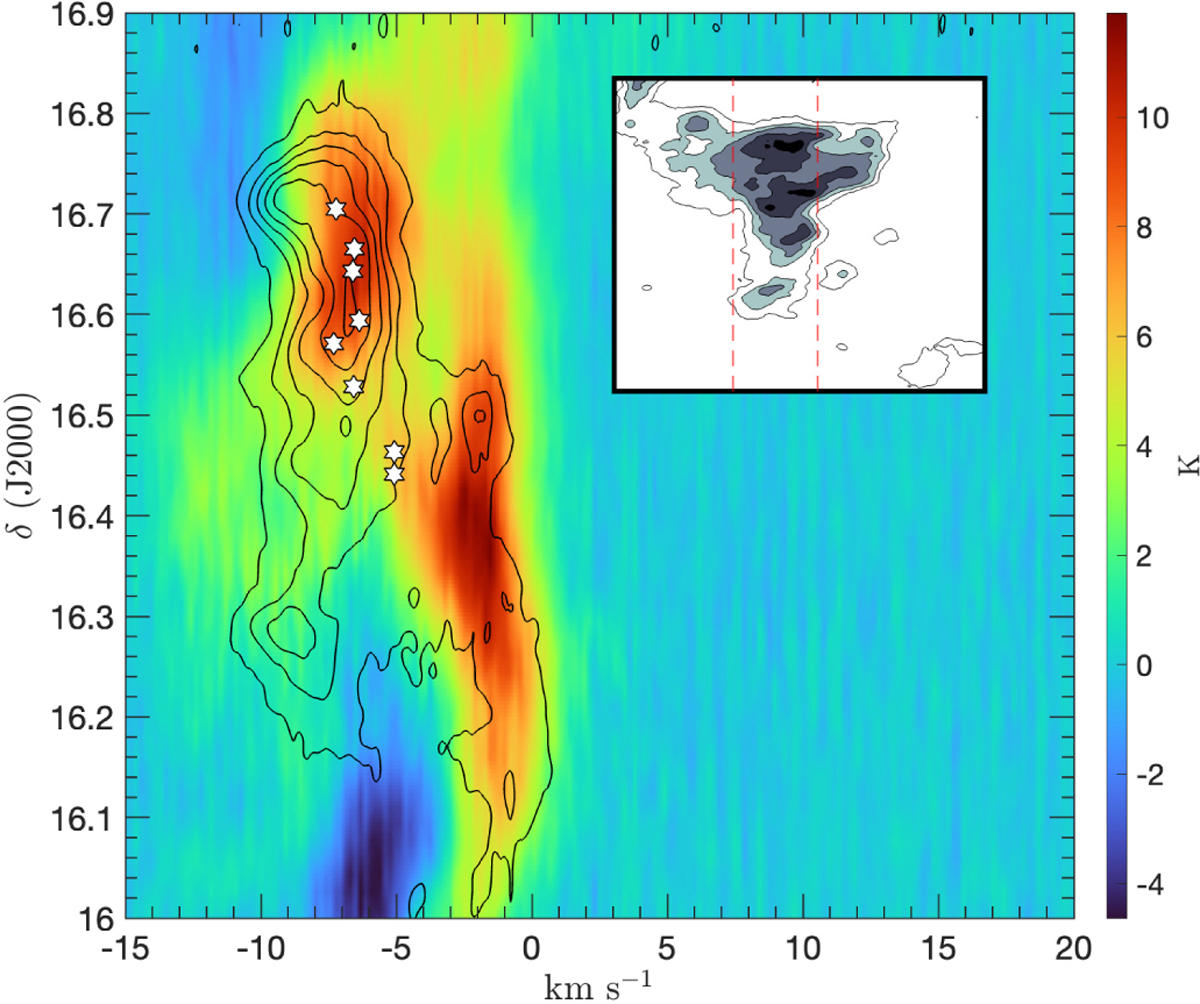
Position-velocity plot of H I (in color) with diffuse component subtracted (see text). The black contours show 12CO mean antenna temperature between 0.2 and 3 K in steps of 0.5 K. White stars indicate the CH velocity centroids. In the insert, we show the RA range (dashed red lines) within which the PV plot is computed. Negative H I antenna temperature arises from the diffuse component subtraction and should be ignored. For a description of extremely diffuse component subtraction, see Monaci et al. (2022).
Current usage metrics show cumulative count of Article Views (full-text article views including HTML views, PDF and ePub downloads, according to the available data) and Abstracts Views on Vision4Press platform.
Data correspond to usage on the plateform after 2015. The current usage metrics is available 48-96 hours after online publication and is updated daily on week days.
Initial download of the metrics may take a while.