Fig. 14
Download original image
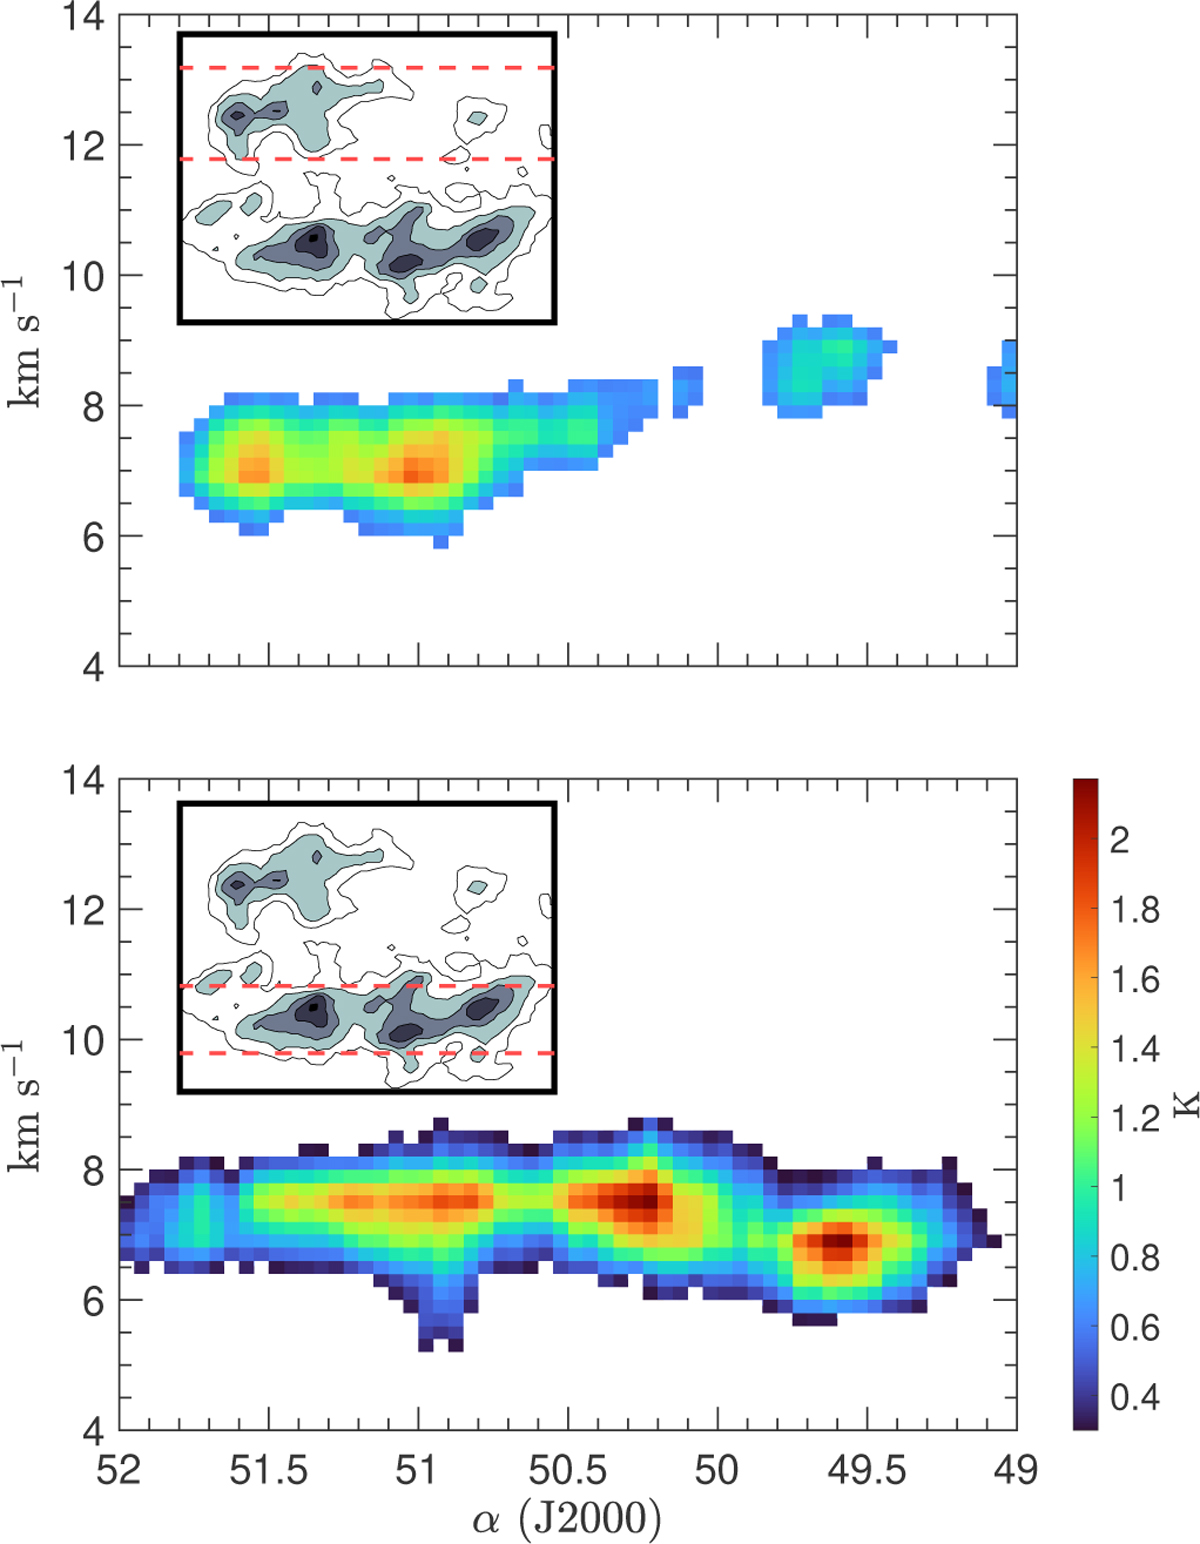
Position-velocity plots for MBM 16. The top and bottom panels show, respectively, the velocity distribution along the right ascension axis for the northern and southern portions of MBM 16. The PV plots were performed by averaging the spectra along declination only within the dotted red lines in each insert. The color bar of the averaged antenna temperature in the lower right corner is the same for both panels.
Current usage metrics show cumulative count of Article Views (full-text article views including HTML views, PDF and ePub downloads, according to the available data) and Abstracts Views on Vision4Press platform.
Data correspond to usage on the plateform after 2015. The current usage metrics is available 48-96 hours after online publication and is updated daily on week days.
Initial download of the metrics may take a while.