Open Access
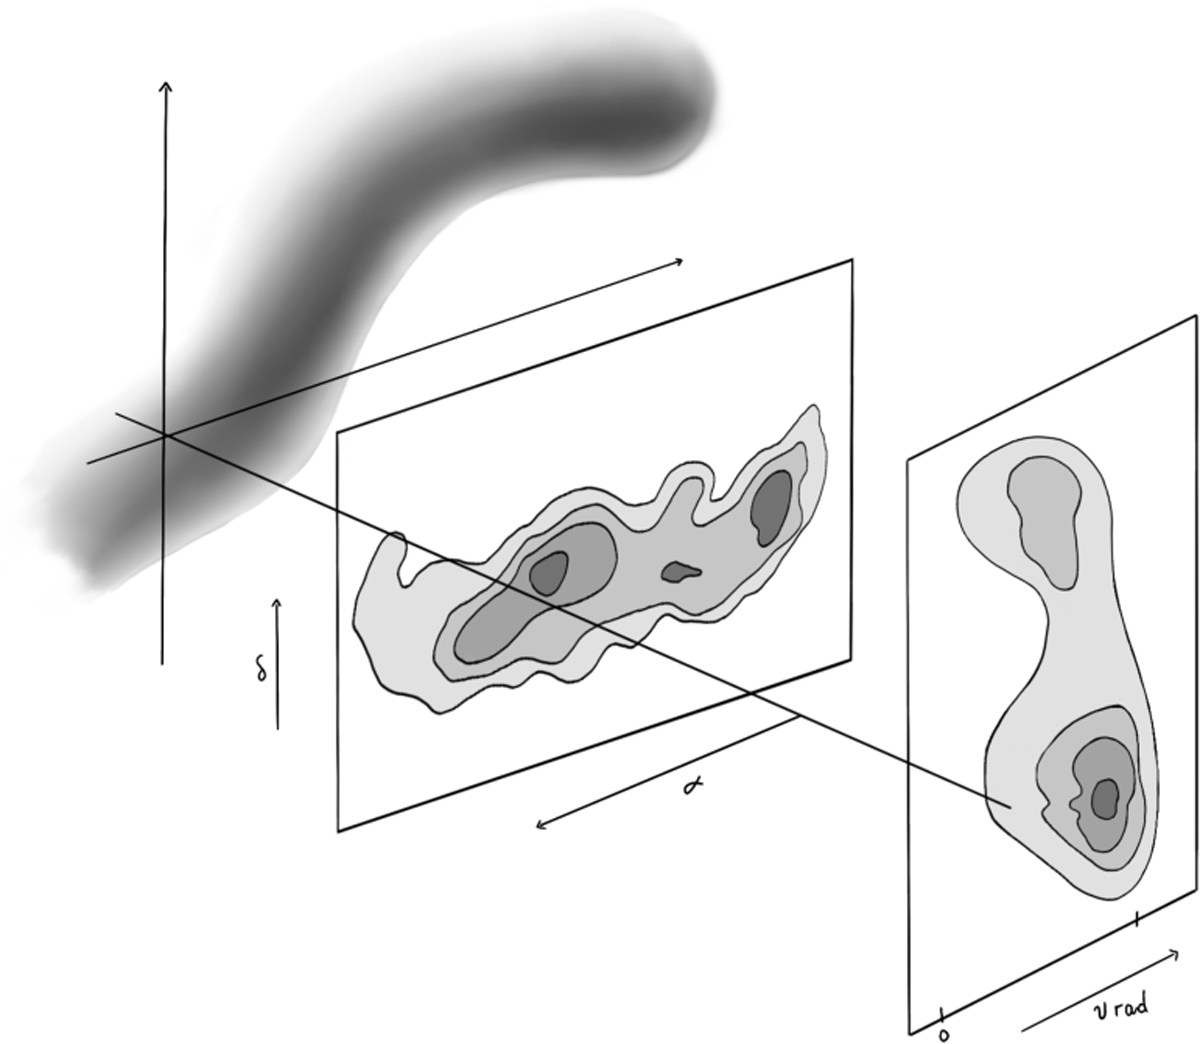
Fig. 15
Download original image
Schematic cartoon of how the MBM 16 PV plots shown in Figure 14 can result from projection effects of a writhing filament, similar to MBM 3 (Figures 12 and 13) and MBM 40 (Monaci et al. 2023). The vertical axis in the PV cartoon is the right ascension.
Current usage metrics show cumulative count of Article Views (full-text article views including HTML views, PDF and ePub downloads, according to the available data) and Abstracts Views on Vision4Press platform.
Data correspond to usage on the plateform after 2015. The current usage metrics is available 48-96 hours after online publication and is updated daily on week days.
Initial download of the metrics may take a while.