Fig. C.1
Download original image
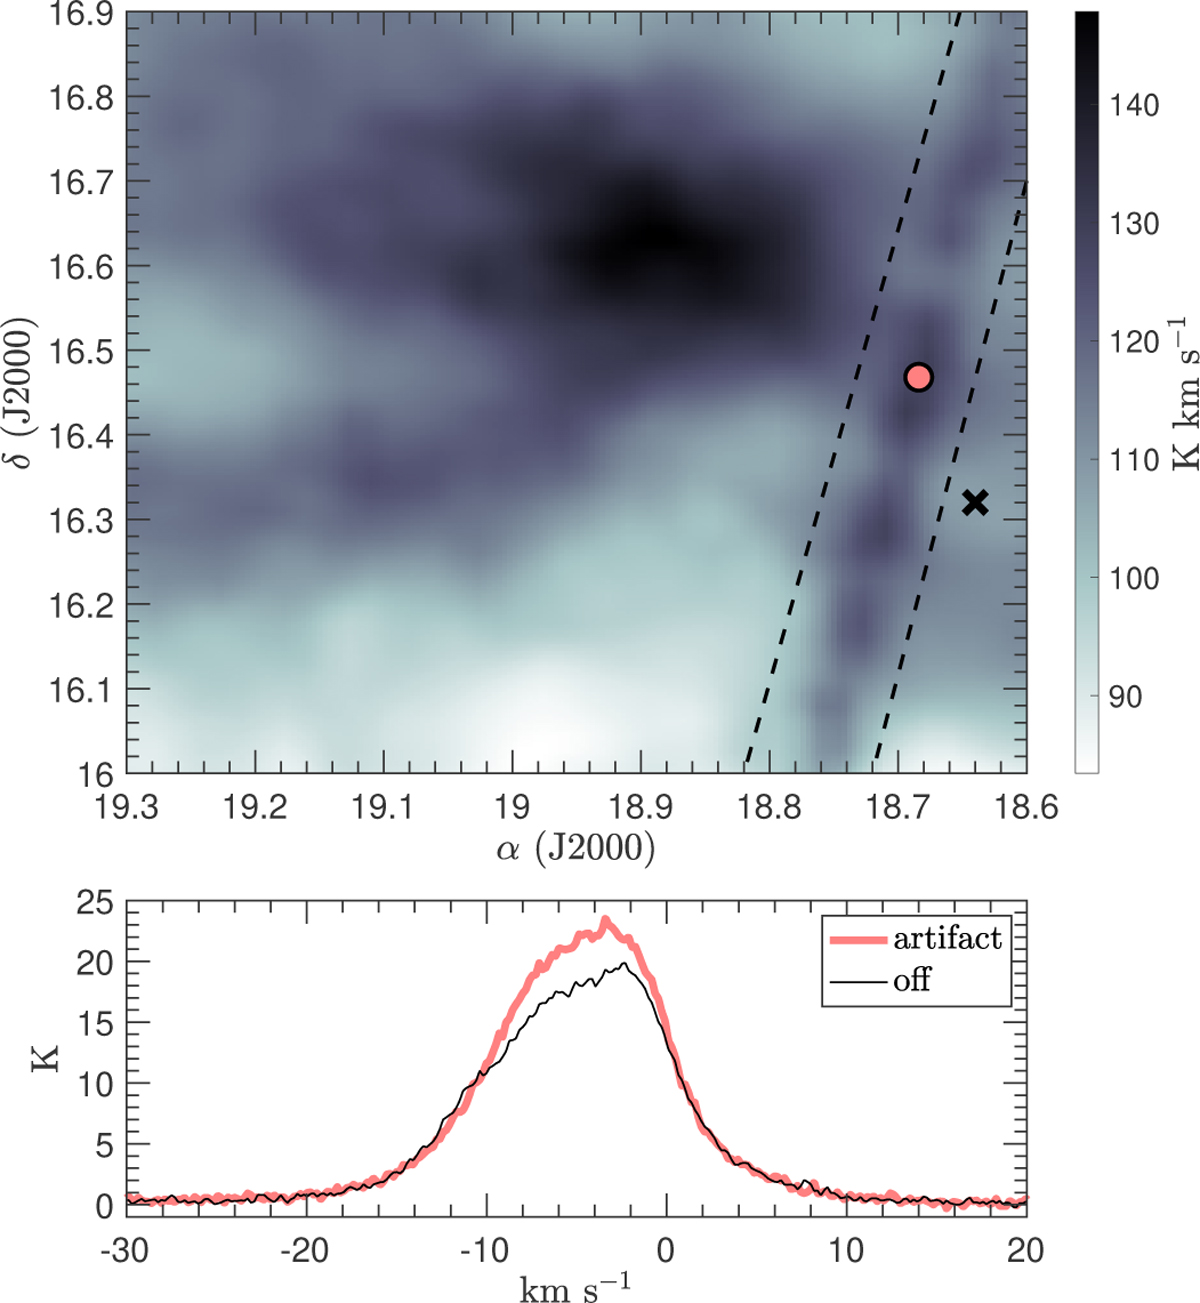
The ripple near MBM 3. The top panel shows the integrated H I antenna temperature, and the two dashed lines bound the artifact, which appears as a series of knots with enhanced antenna temperature. The bottom panel displays two H I spectra, one depicted by the thick orange line is within the artifact (the position is indicated in the top panel by an orange dot), and the other is outside the ripple, depicted by the thin black line in the bottom panel at the position highlighted by a black “x” in the top panel.
Current usage metrics show cumulative count of Article Views (full-text article views including HTML views, PDF and ePub downloads, according to the available data) and Abstracts Views on Vision4Press platform.
Data correspond to usage on the plateform after 2015. The current usage metrics is available 48-96 hours after online publication and is updated daily on week days.
Initial download of the metrics may take a while.