Fig. 2
Download original image
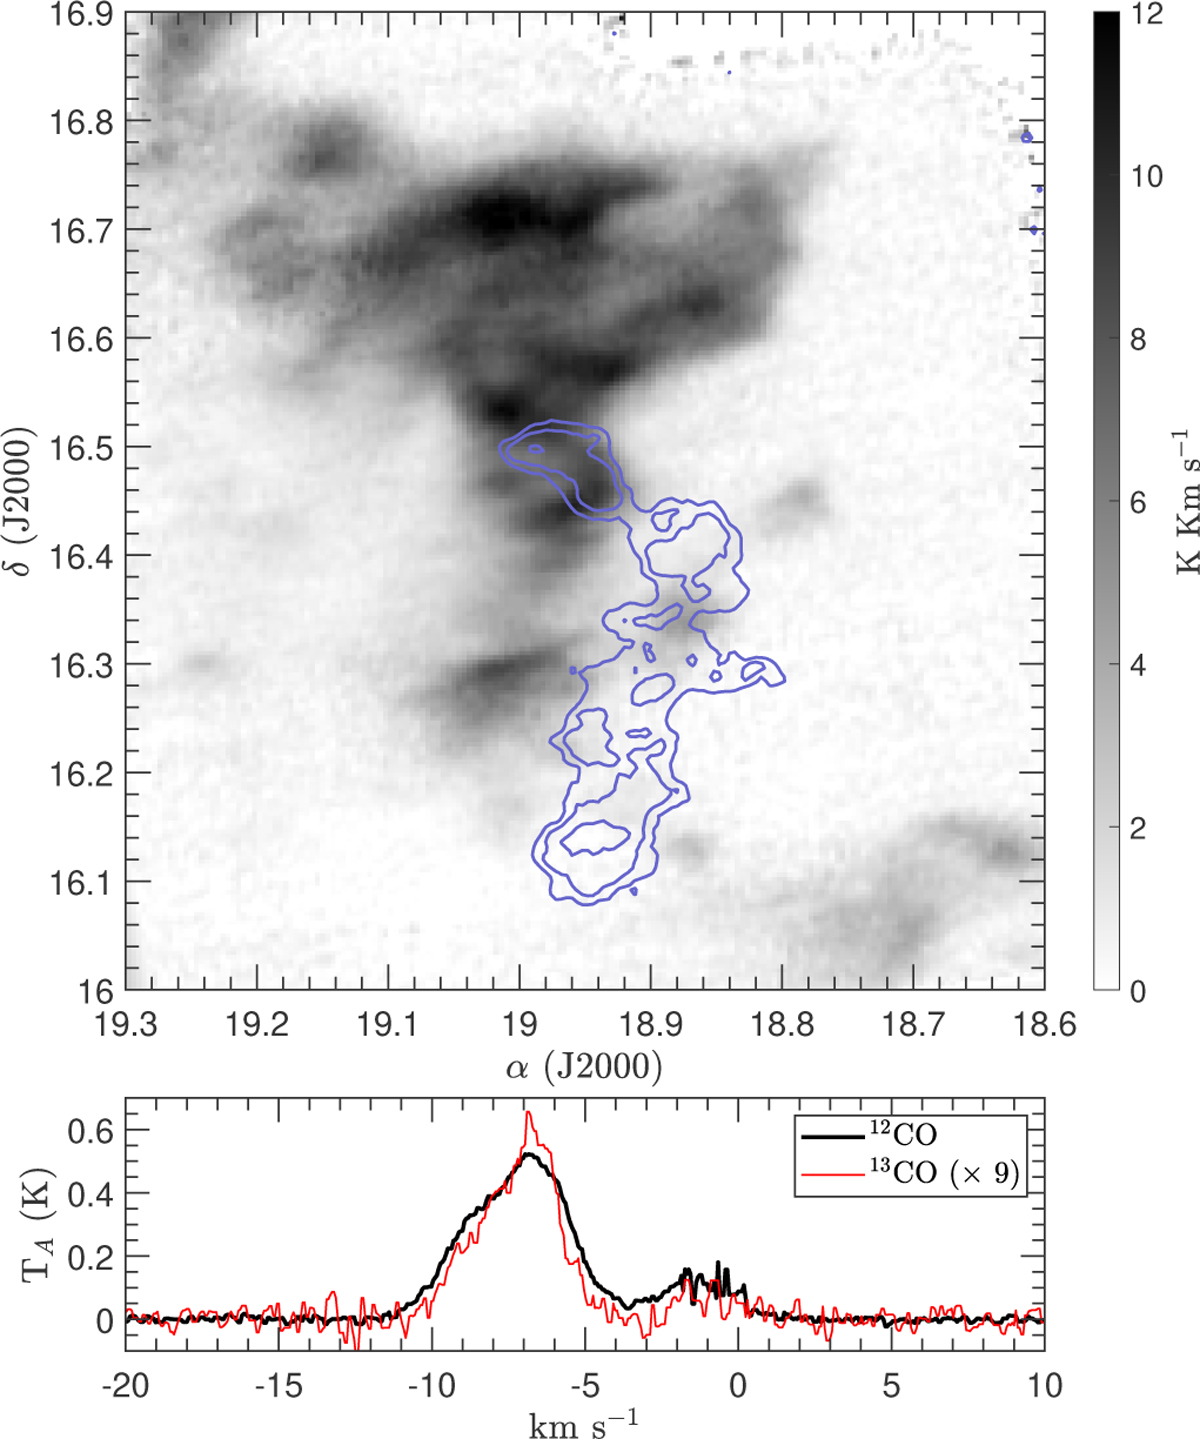
Integrated 12CO antenna temperature map of MBM 3 of the primary cloud between -10.9 and -4.9 km s-1 (gray scale), and integrated 12CO antenna temperature of the outlier cloud between -2.5 and 1.2 km s-1 (pale blue contours). The bottom panel shows 12CO (thick black line) and 13CO (thin red line) averaged spectrum over the whole cloud. The highest peak traces the gas linked with the primary cloud, while the other peak traces the outlier cloud, which shows virtually no 13CO emission. The 13CO spectrum is multiplied by a factor of nine for clarity.
Current usage metrics show cumulative count of Article Views (full-text article views including HTML views, PDF and ePub downloads, according to the available data) and Abstracts Views on Vision4Press platform.
Data correspond to usage on the plateform after 2015. The current usage metrics is available 48-96 hours after online publication and is updated daily on week days.
Initial download of the metrics may take a while.