Fig. 5
Download original image
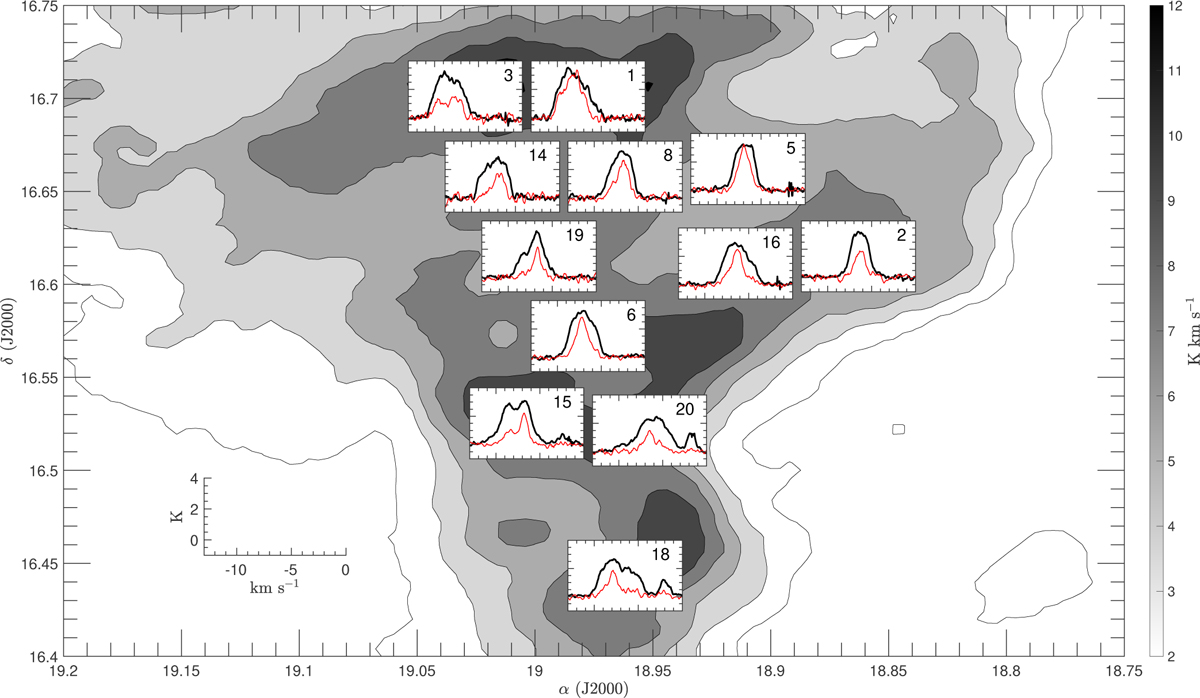
Selected positions of CO corresponding to the CH positions reported in Figure 4. The location of each subplot is indicative of pointings observed both in 12CO and 13CO. The filled contours are the same as in Figure 4. In each subplot, the thick black line is 12CO and the thin red line is 13CO multiplied by a factor of three for clarity. A frame with the same scale and range for each subplot is reported in the bottom left corner of the figure.
Current usage metrics show cumulative count of Article Views (full-text article views including HTML views, PDF and ePub downloads, according to the available data) and Abstracts Views on Vision4Press platform.
Data correspond to usage on the plateform after 2015. The current usage metrics is available 48-96 hours after online publication and is updated daily on week days.
Initial download of the metrics may take a while.