Fig. 6
Download original image
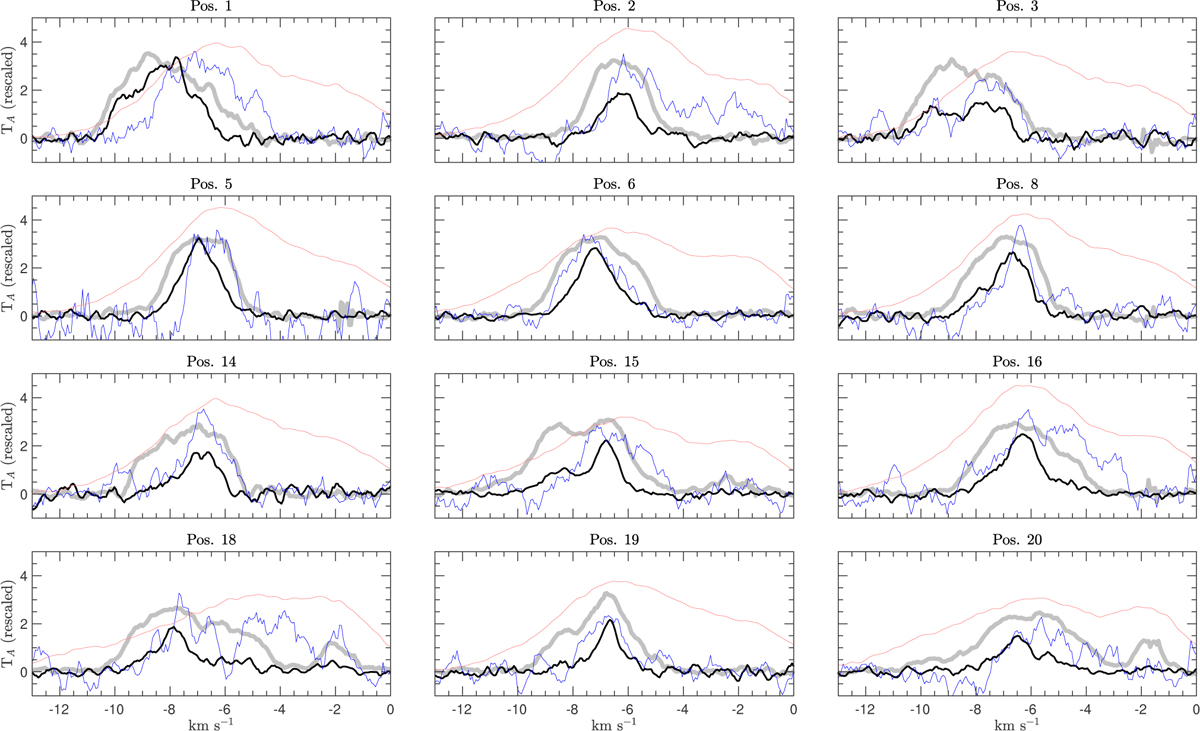
Detailed spectra of CO, CH, and H I for the positions in Figure 5. The thick gray line is 12CO, the thick black line is 13CO, the thin blue line is CH, and the thin red line is H I. The 12CO profiles are reported without any rescaling, but the CH was multiplied by a factor of 60-130, depending on the position, so it is possible to compare with 12CO. Similarly, the HI was multiplied by a factor of 0.15 for all positions.
Current usage metrics show cumulative count of Article Views (full-text article views including HTML views, PDF and ePub downloads, according to the available data) and Abstracts Views on Vision4Press platform.
Data correspond to usage on the plateform after 2015. The current usage metrics is available 48-96 hours after online publication and is updated daily on week days.
Initial download of the metrics may take a while.