Fig. 7
Download original image
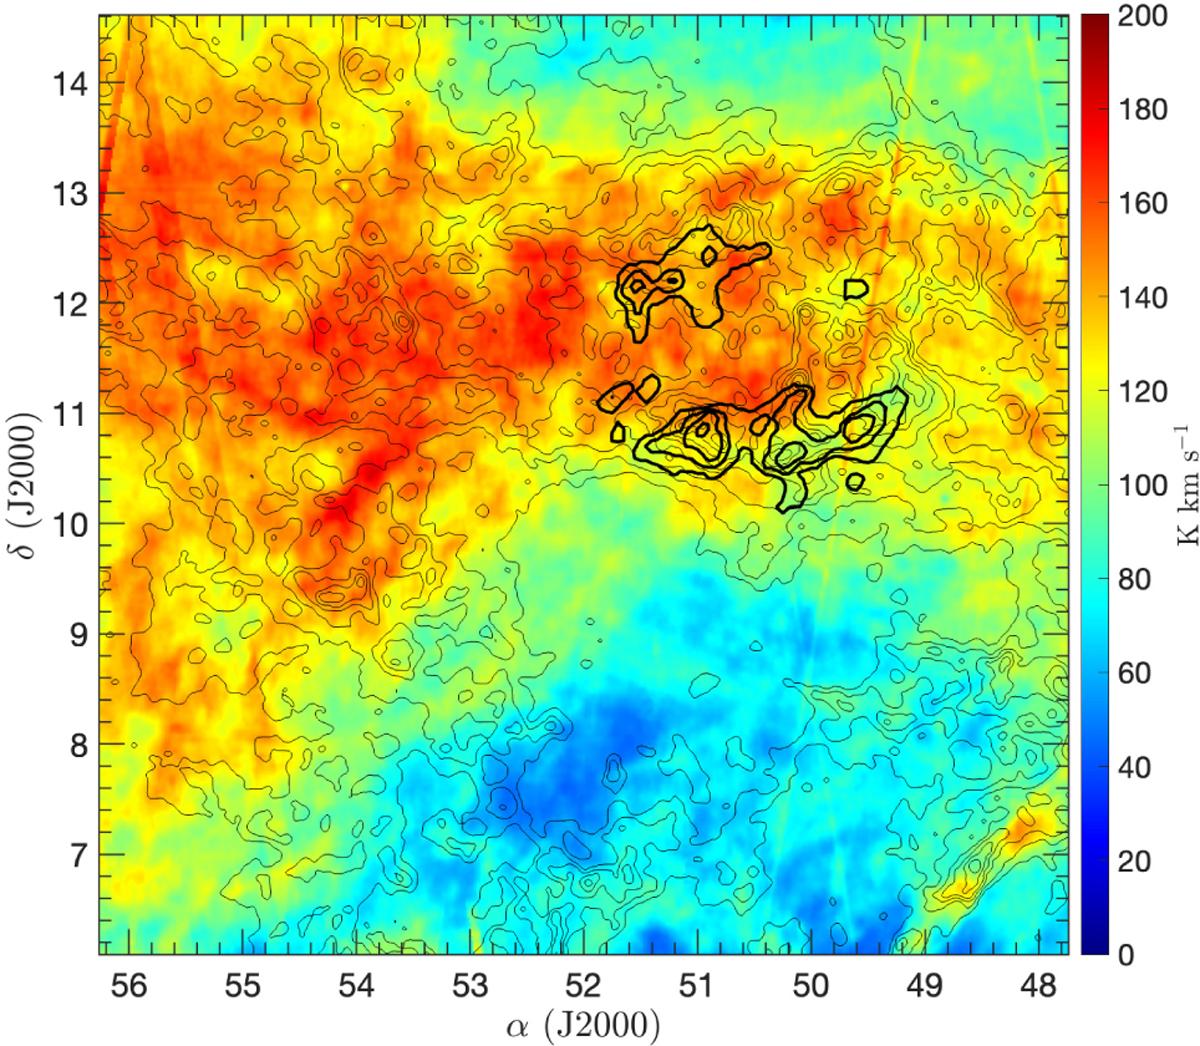
8° × 8° composite image of MBM16 and surroundings. The filled colored image represents an integrated H I antenna temperature between 6 and 9 km s-1, the thin contours depict the dust distribution as seen by 100 µm IRIS channel, and the thick contours are the integrated 12CO antenna temperature between the same interval of H I. Note that MBM 16 lies amidst a wider atomic filament.
Current usage metrics show cumulative count of Article Views (full-text article views including HTML views, PDF and ePub downloads, according to the available data) and Abstracts Views on Vision4Press platform.
Data correspond to usage on the plateform after 2015. The current usage metrics is available 48-96 hours after online publication and is updated daily on week days.
Initial download of the metrics may take a while.