Fig. 8
Download original image
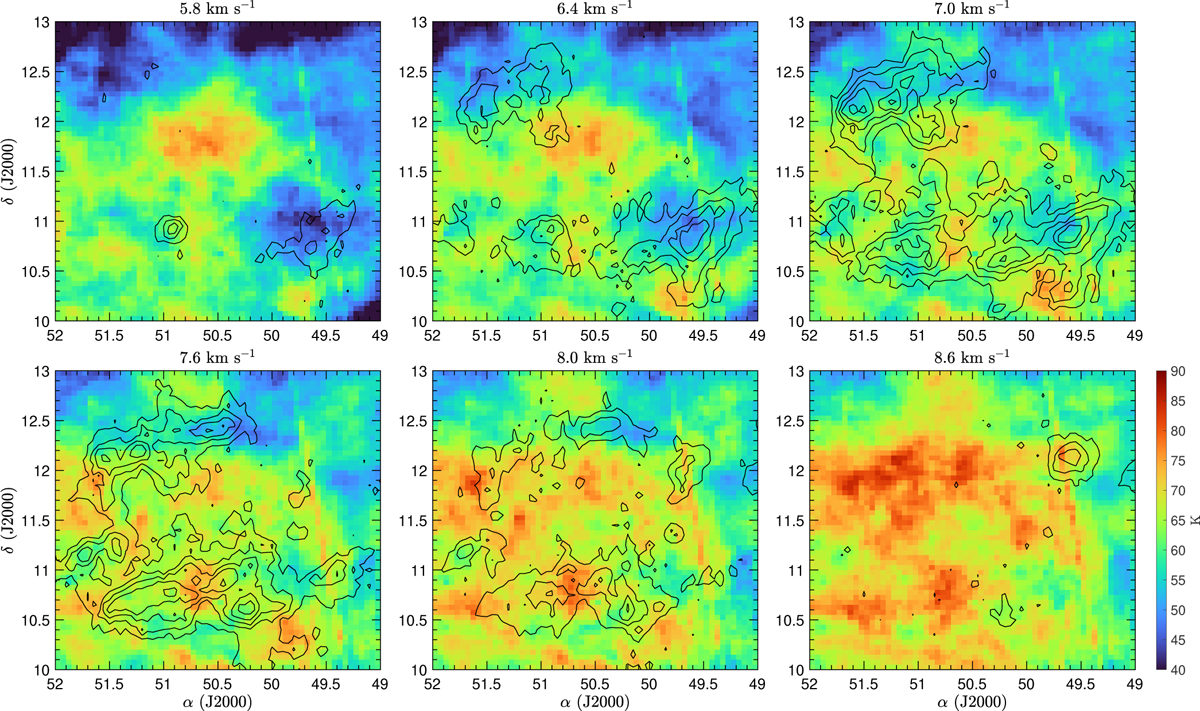
Velocity slices in MBM 16 discussed in Section 4.2. The contours show the 12CO distribution and the levels are from 0.5 to 2.5 K in steps of 0.5 K, superposed on HI (filled map). The color map is the same in all panels, and the antenna temperature scale is shown in the lower right corner. The tilted stripe on the right, particularly evident in the bottom panels, is an artifact caused by the HI mapping technique (see Appendix C).
Current usage metrics show cumulative count of Article Views (full-text article views including HTML views, PDF and ePub downloads, according to the available data) and Abstracts Views on Vision4Press platform.
Data correspond to usage on the plateform after 2015. The current usage metrics is available 48-96 hours after online publication and is updated daily on week days.
Initial download of the metrics may take a while.