Fig. 1.
Download original image
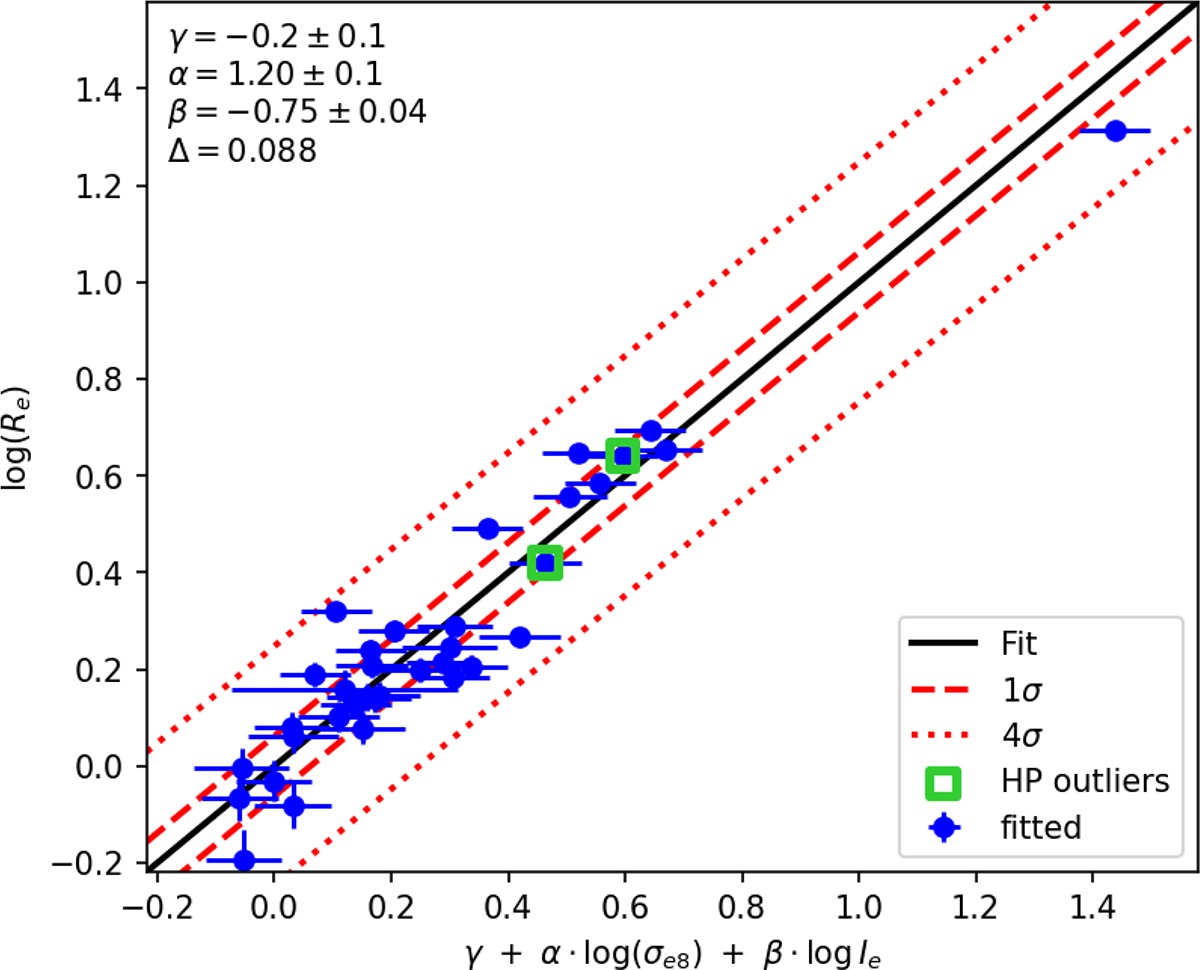
Fit to the classic FP (Eq. (1)) built with a sample of 35 secure ETGs selected as members of the galaxy cluster PLCK-G287. The aperture-corrected central stellar velocity dispersion (σe8) is expressed in km s−1, the surface brightness (Ie) in L⊙ pc−2, and the circularized effective radius (Re) in kpc. The solid black line is the projection of the best-fitting plane, and the dashed and dotted red lines indicate the 1 and 4 standard deviation intervals, respectively. Green squares indicate the two objects that are found to be outliers of the M⋆ and fe⋆ HPs.
Current usage metrics show cumulative count of Article Views (full-text article views including HTML views, PDF and ePub downloads, according to the available data) and Abstracts Views on Vision4Press platform.
Data correspond to usage on the plateform after 2015. The current usage metrics is available 48-96 hours after online publication and is updated daily on week days.
Initial download of the metrics may take a while.