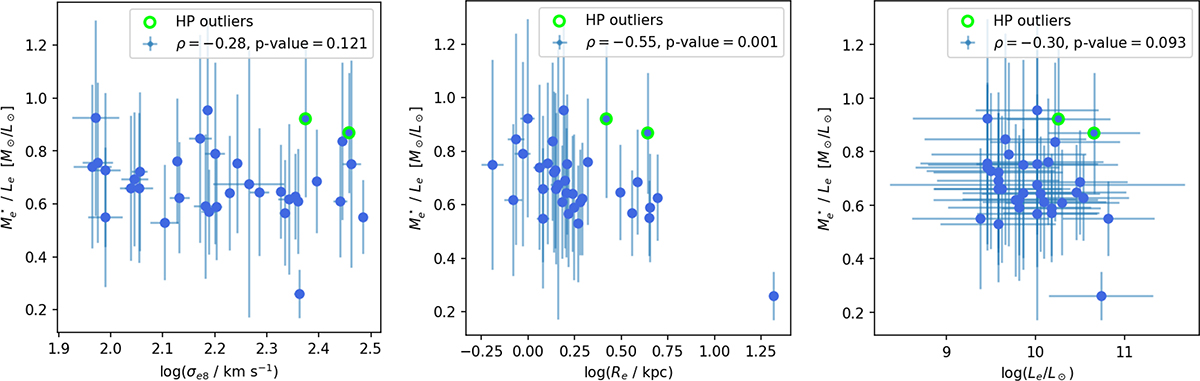
Fig. 5.
Download original image
Stellar M/L ratio, computed within the circularized effective radius (Re), as a function of log(σe8) (left panel), log(Re) (middle panel), and log(Le) (right panel). Each plot also reports the Spearman’s rank correlation coefficient and its p-value. There is no evident trend in Me⋆/Le with respect to log(σe8) or log(Le). There seems to be a weak trend with respect to log(Re) up to ∼5.5 kpc. The variations in Me⋆/Le across this sample of galaxies could explain the remaining scatter in the stellar mass HP.
Current usage metrics show cumulative count of Article Views (full-text article views including HTML views, PDF and ePub downloads, according to the available data) and Abstracts Views on Vision4Press platform.
Data correspond to usage on the plateform after 2015. The current usage metrics is available 48-96 hours after online publication and is updated daily on week days.
Initial download of the metrics may take a while.