Fig. 6.
Download original image
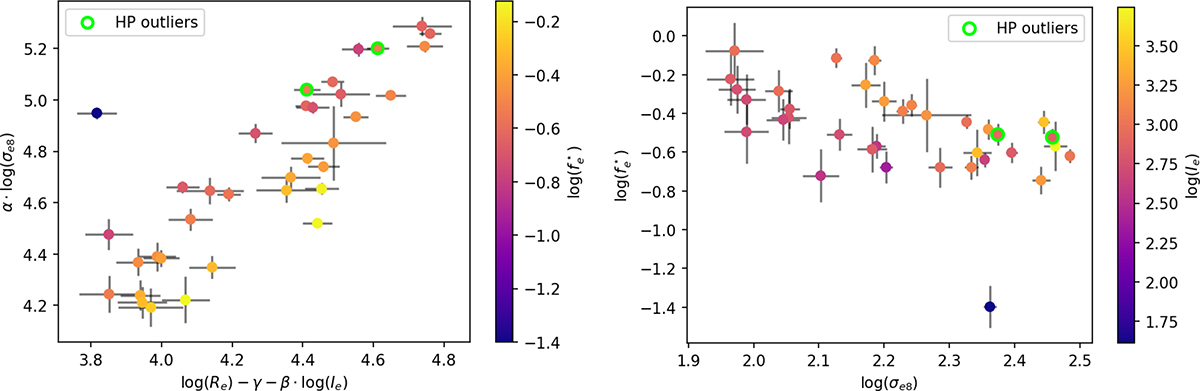
Two projections of the stellar mass fraction HP: one with log(σe8) as a function of log(Re)−γ − βlog(Ie) (left panel) and one with ![]() as a function of log(σe8) (right panel). The color of the points indicates values of log(fe⋆) and log(Ie). Both plots highlight the dependence on the stellar mass fraction. The one on the left, in particular, is another way to plot the FP and shows how ETGs with similar stellar mass fractions seem to lie on planes with different slopes and intercepts. The isolated object with a peculiarly low value of fe⋆ is the one with n = 7.86 described in Appendix C.
as a function of log(σe8) (right panel). The color of the points indicates values of log(fe⋆) and log(Ie). Both plots highlight the dependence on the stellar mass fraction. The one on the left, in particular, is another way to plot the FP and shows how ETGs with similar stellar mass fractions seem to lie on planes with different slopes and intercepts. The isolated object with a peculiarly low value of fe⋆ is the one with n = 7.86 described in Appendix C.
Current usage metrics show cumulative count of Article Views (full-text article views including HTML views, PDF and ePub downloads, according to the available data) and Abstracts Views on Vision4Press platform.
Data correspond to usage on the plateform after 2015. The current usage metrics is available 48-96 hours after online publication and is updated daily on week days.
Initial download of the metrics may take a while.