Fig. 12
Download original image
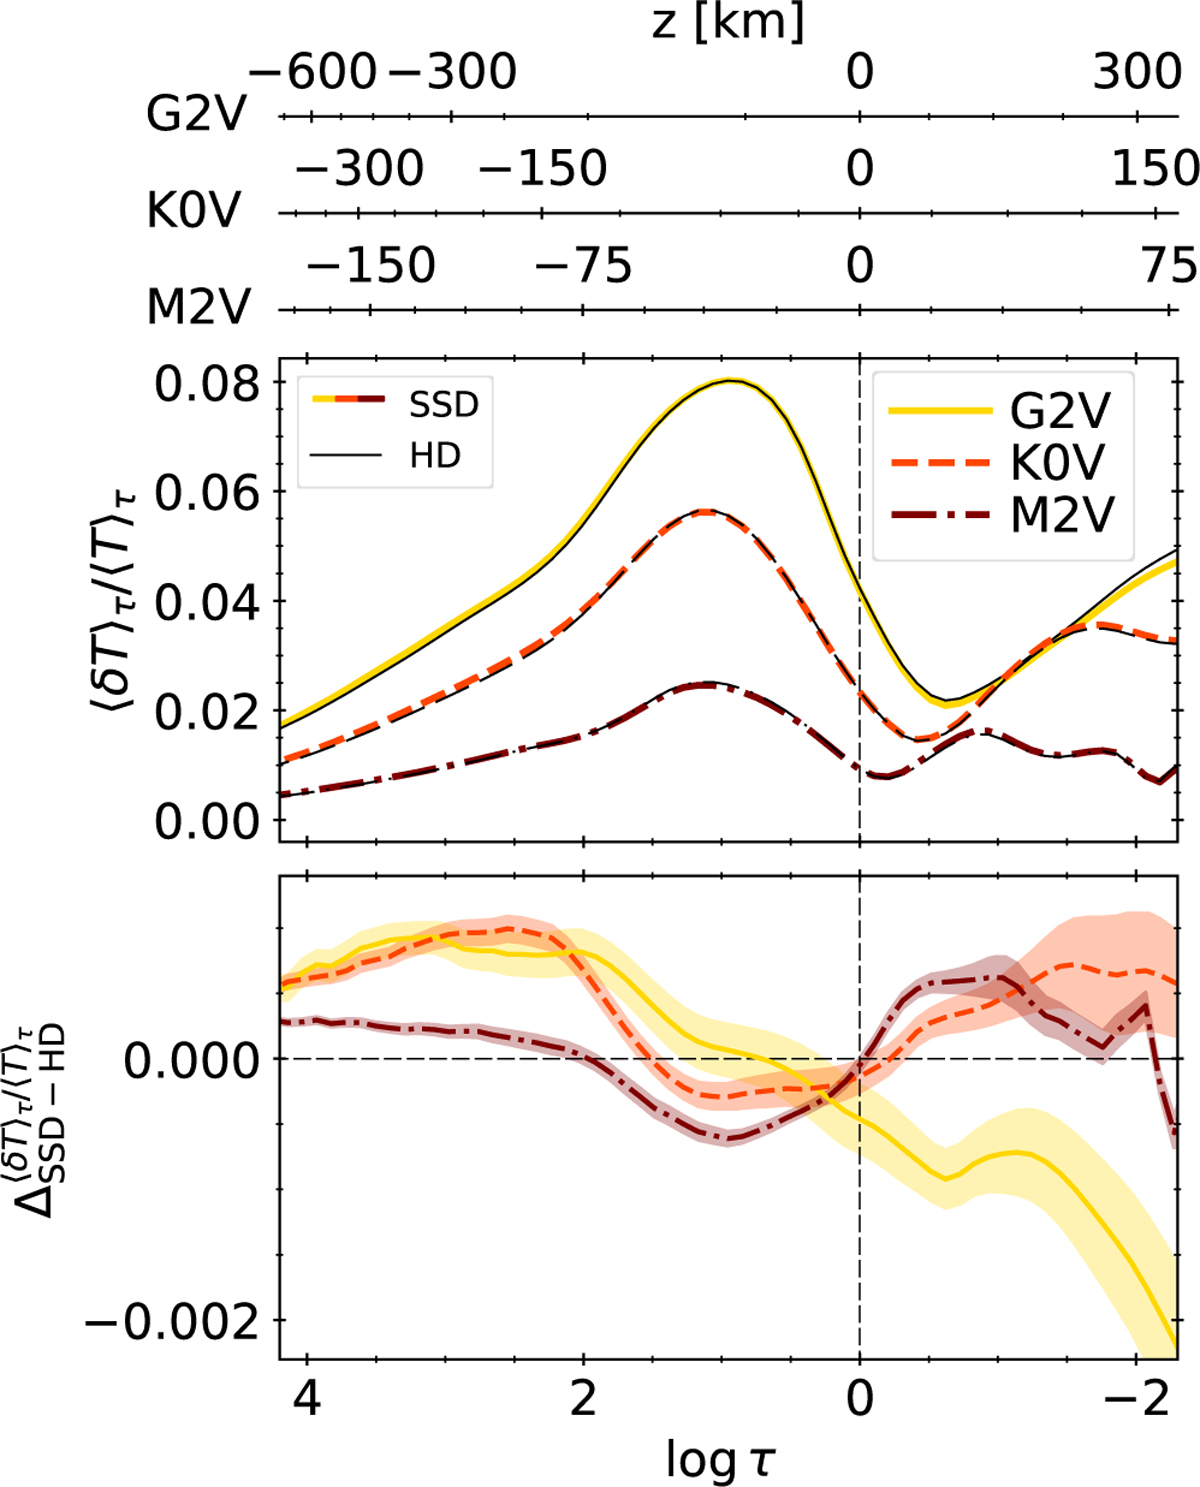
Temperature contrast averaged over Rosseland iso-τ surfaces and time for the three spectral types. The contrast is computed as the standard deviation of the temperature divided by its mean. Similarly to Fig. 4, the temperature contrast is shown in the top row (with the values from the SSD and HD simulations in thick coloured and thin black lines, respectively) and the differences between the values from the SSD and HD simulations (Eq. (9)) are shown in the bottom row, with the errors as shaded areas. The three top axes show the geometrical height for the three stars.
Current usage metrics show cumulative count of Article Views (full-text article views including HTML views, PDF and ePub downloads, according to the available data) and Abstracts Views on Vision4Press platform.
Data correspond to usage on the plateform after 2015. The current usage metrics is available 48-96 hours after online publication and is updated daily on week days.
Initial download of the metrics may take a while.