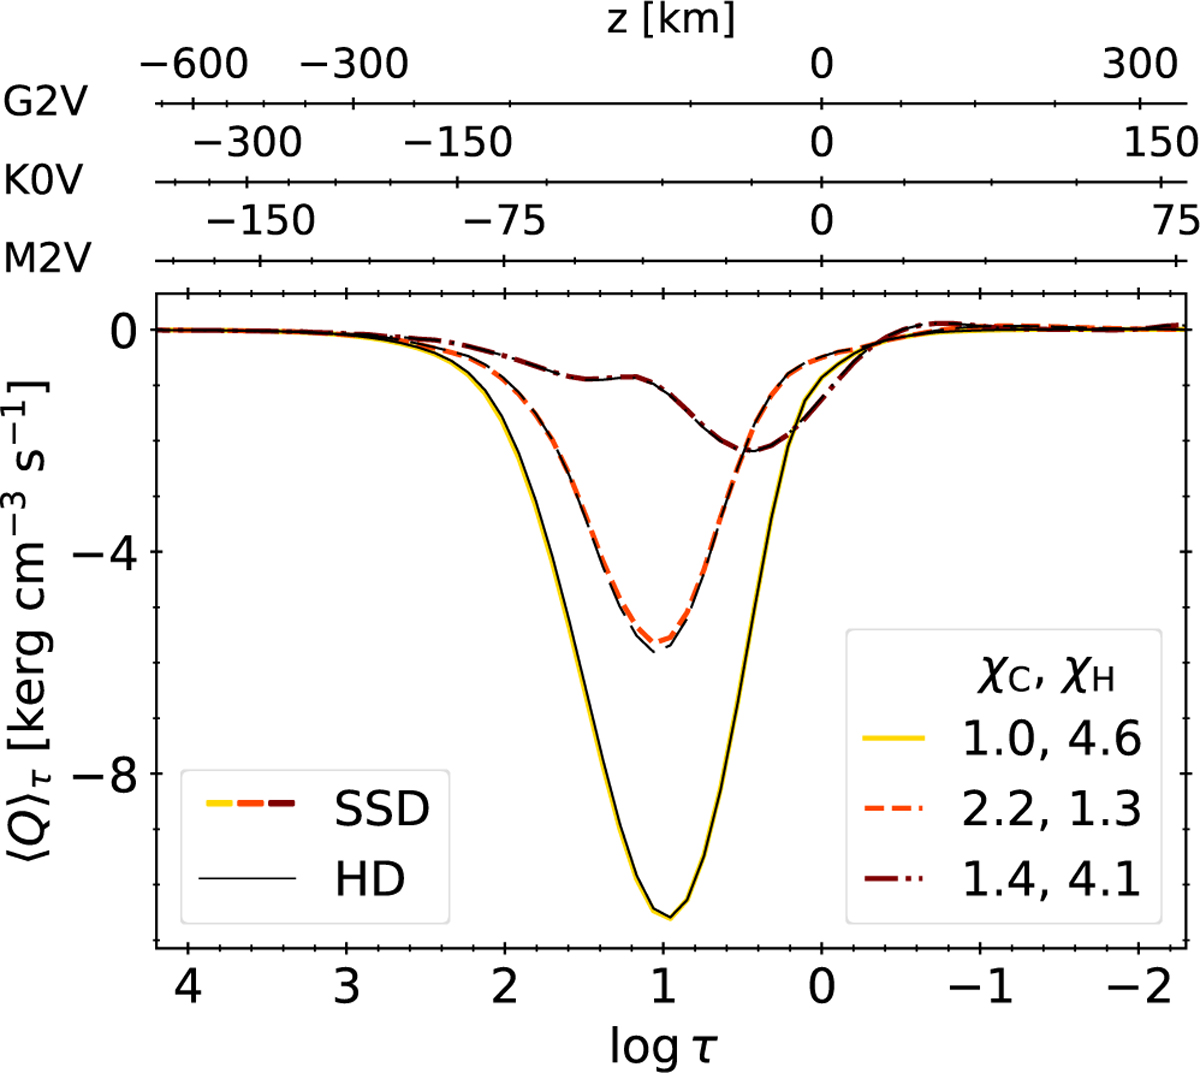
Fig. 13
Download original image
Energy exchange rate Q averaged over time and Rosseland iso-τ surfaces for the three stars. Similarly to Fig. 4, the values from the SSD and HD simulations are shown in thick coloured and thin black lines, respectively. The deviations χ (Eqs. (12) and (13), with Q(1) = QSSD and Q(2) = QHD) are Splayed in the legend. The three top axes show the geometrical height for the three stars.
Current usage metrics show cumulative count of Article Views (full-text article views including HTML views, PDF and ePub downloads, according to the available data) and Abstracts Views on Vision4Press platform.
Data correspond to usage on the plateform after 2015. The current usage metrics is available 48-96 hours after online publication and is updated daily on week days.
Initial download of the metrics may take a while.