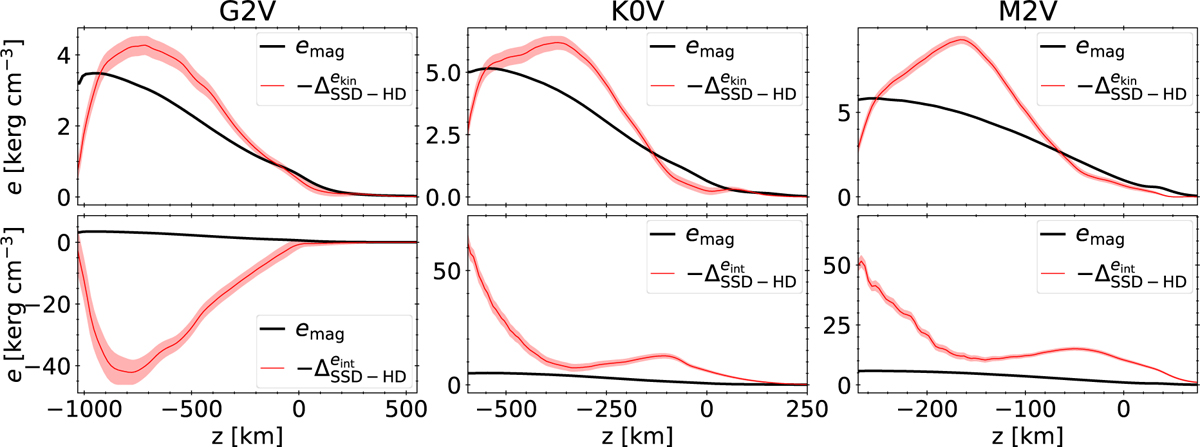
Fig. 16
Download original image
Magnetic energy averaged over surfaces of constant geometrical height and time from the SSD runs (black lines), compared to the difference in kinetic (top row) and internal (bottom) energy (Eq. (9) multiplied by –1; red lines) between the HD and SSD runs. Shaded areas show ![]() for the magnetic energy and the error (Eq. (3)) for the difference of energy between the SSD and HD cases.
for the magnetic energy and the error (Eq. (3)) for the difference of energy between the SSD and HD cases.
Current usage metrics show cumulative count of Article Views (full-text article views including HTML views, PDF and ePub downloads, according to the available data) and Abstracts Views on Vision4Press platform.
Data correspond to usage on the plateform after 2015. The current usage metrics is available 48-96 hours after online publication and is updated daily on week days.
Initial download of the metrics may take a while.