Fig. 17
Download original image
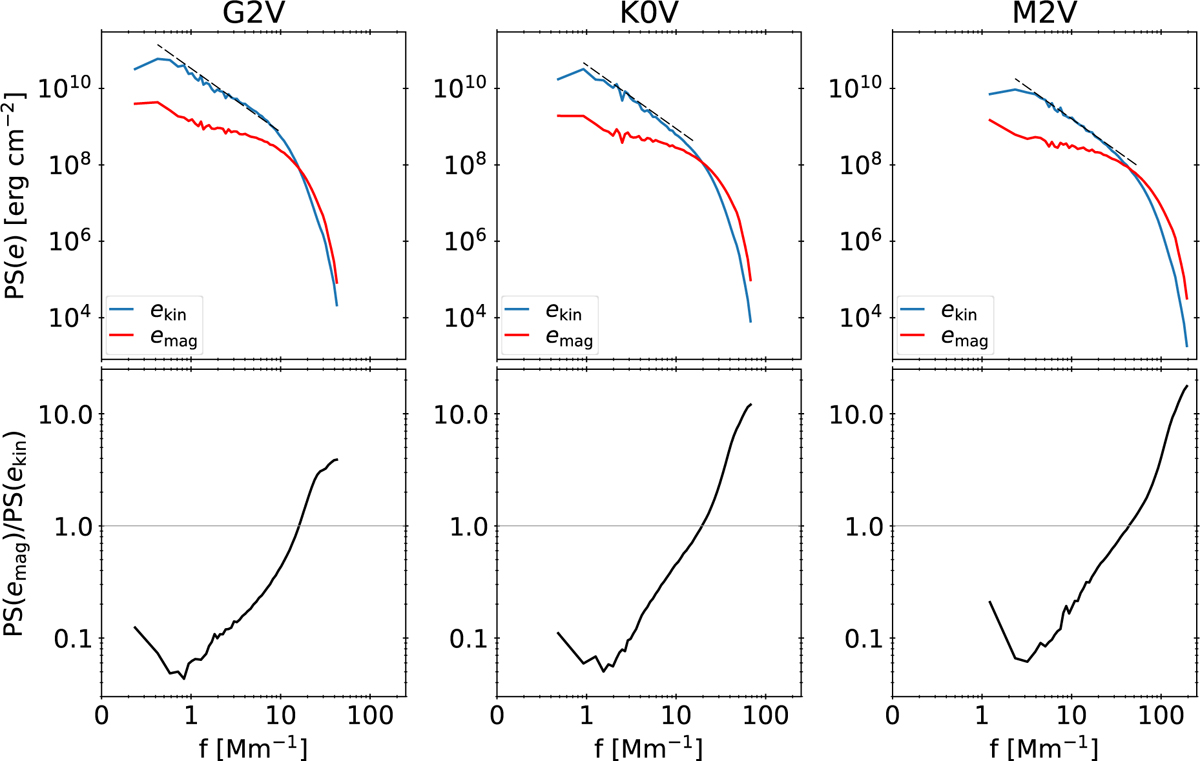
Time averaged radial spatial power spectra (top row) of the kinetic (blue lines) and magnetic (red) energies at τ = 1 for the SSD runs of the three stars (different columns). In dashed lines we show the curve a × f–5/3 (Kolmogorov power law, where a is a constant), where f is the radial spatial frequency. The ratio of the spatial power spectra of the magnetic energy and the spatial power spectra of the kinetic energy is shown in the bottom row.
Current usage metrics show cumulative count of Article Views (full-text article views including HTML views, PDF and ePub downloads, according to the available data) and Abstracts Views on Vision4Press platform.
Data correspond to usage on the plateform after 2015. The current usage metrics is available 48-96 hours after online publication and is updated daily on week days.
Initial download of the metrics may take a while.